When I first started lifting in the mid-2000s, one near-ubiquitous piece of advice was that lifters should aim to consume about 1 gram of protein per pound of body weight (or 2.2g/kg). I don’t recall ever seeing an in-depth scientific discussion about the topic, but I also wasn’t particularly tapped into “evidence-based” lifting circles at the time, so do with that what you will.
However, I do vividly remember when a meta-analysis on the topic of optimal protein intake for lifters was published in 2018 by Morton and colleagues1. After this point, the dominant thinking on protein intake shifted drastically, with most people believing that the benefits of consuming more protein maxed out at around 0.7-0.8g/lb, and the classic “1g/lb” recommendation was labeled a “myth” or “broscience.”
This 2018 meta-analysis included 49 studies with a total of 1863 participants. To be included, a study needed to include at least 6 weeks of resistance training, and it couldn’t intentionally restrict energy intake (i.e. weight loss studies were excluded). The main takeaway of the meta-analysis was pretty simple and straightforward: “protein intakes at amounts greater than ~1.6 g/kg/day do not further contribute [resistance training]-induced gains in [fat free mass].”
To arrive at this conclusion, the researchers plotted protein intakes (x-value) versus changes in fat-free mass (y-value), and performed a biphasic linear regression to identify a “breakpoint”: the point past which further increases in protein intake fail to yield further increases in fat-free mass (i.e., the point past which the slope of a linear trendline equals 0). For this analysis, a total of 42 study arms with a total of 723 subjects were included. You can see the resulting figure below.
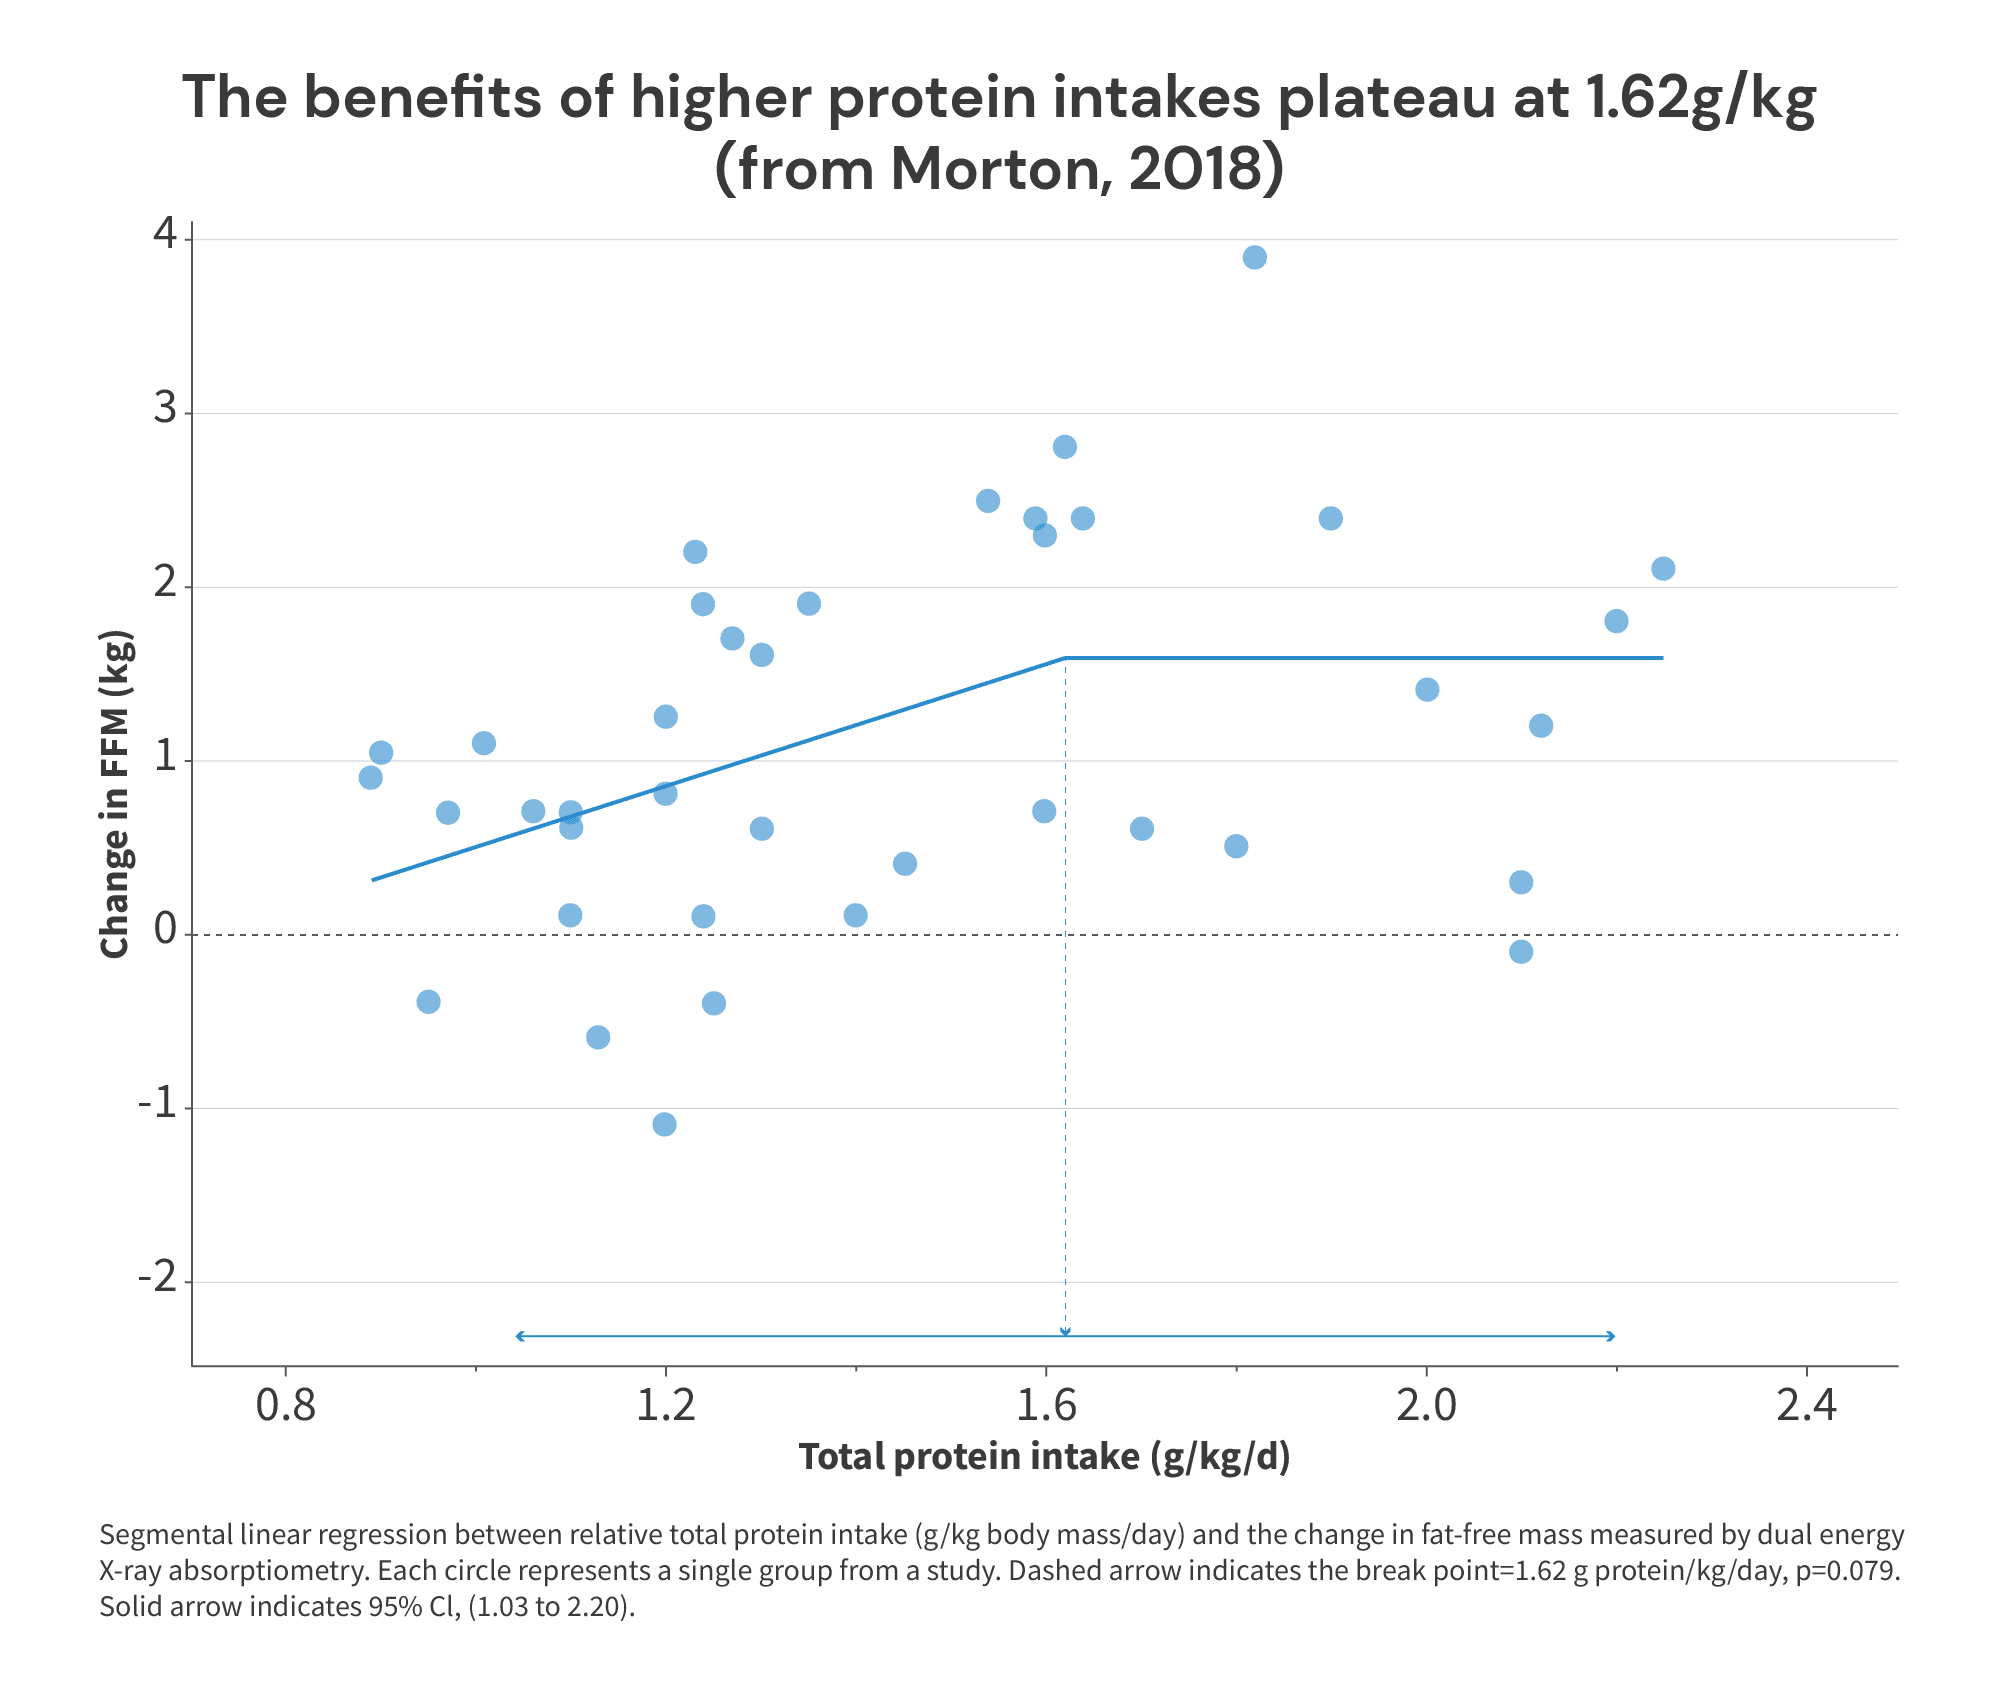

As you can see, the breakpoint is at 1.62g/kg (about 0.74g/lb), suggesting that increases in protein intake beyond 1.62g/kg fail to yield further increases in fat-free mass. Simple enough, right?
Well … this figure itself should have clued most people into the fact that this wasn’t necessarily an open-and-shut case. For starters, the breakpoint itself wasn’t even statistically significant (p = 0.079). We could certainly quibble about how much weight we should place on “significance” as a (fairly arbitrary) statistical threshold in most cases. But a meta-analysis is a place where you’d really expect to see statistically significant results if what you’re analyzing is a “real” effect, simply because a meta-analysis should give you such a large increase in statistical power compared to a standalone trial. So, we never should have had a ton of faith in 1.62g/kg as a particularly accurate or precise breakpoint.
Relatedly, the confidence interval for the (non-significant) breakpoint spanned a range from 1.03-2.20 g/kg. Notably, the protein intakes meta-analyzed spanned a range that was only slightly wider than the confidence interval of the breakpoint: about 0.9-2.25 g/kg. In other words, the range of plausible values for the (non-significant) breakpoint wasn’t a tight, specific range of values within the dataset – it spanned almost the entire range of protein intakes studied.
In other words, these results have been broadly interpreted as saying “we have a lot of confidence that you won’t derive hypertrophic benefits from consuming more than 1.62g of protein per kg of body mass.” However, a reading that better reflects the actual statistical results of the breakpoint analysis would be something much closer to, “we’re not particularly confident that there is a point past which increasing protein intake fails to yield further increases in fat-free mass. And, if that point exists, we’re also not particularly confident about where it might lie.”
Furthermore, the Morton meta-analysis itself also presents data suggesting that the breakpoint (if one exists) is probably higher than 1.62g/kg. But, these data can only be found in some supplementary figures that haven’t received nearly as much attention as the breakpoint analysis pictured above (but which are no less valid or informative), so I think most people have completely overlooked them. Namely, we need to turn our attention to Supplementary Figures 3A-D:
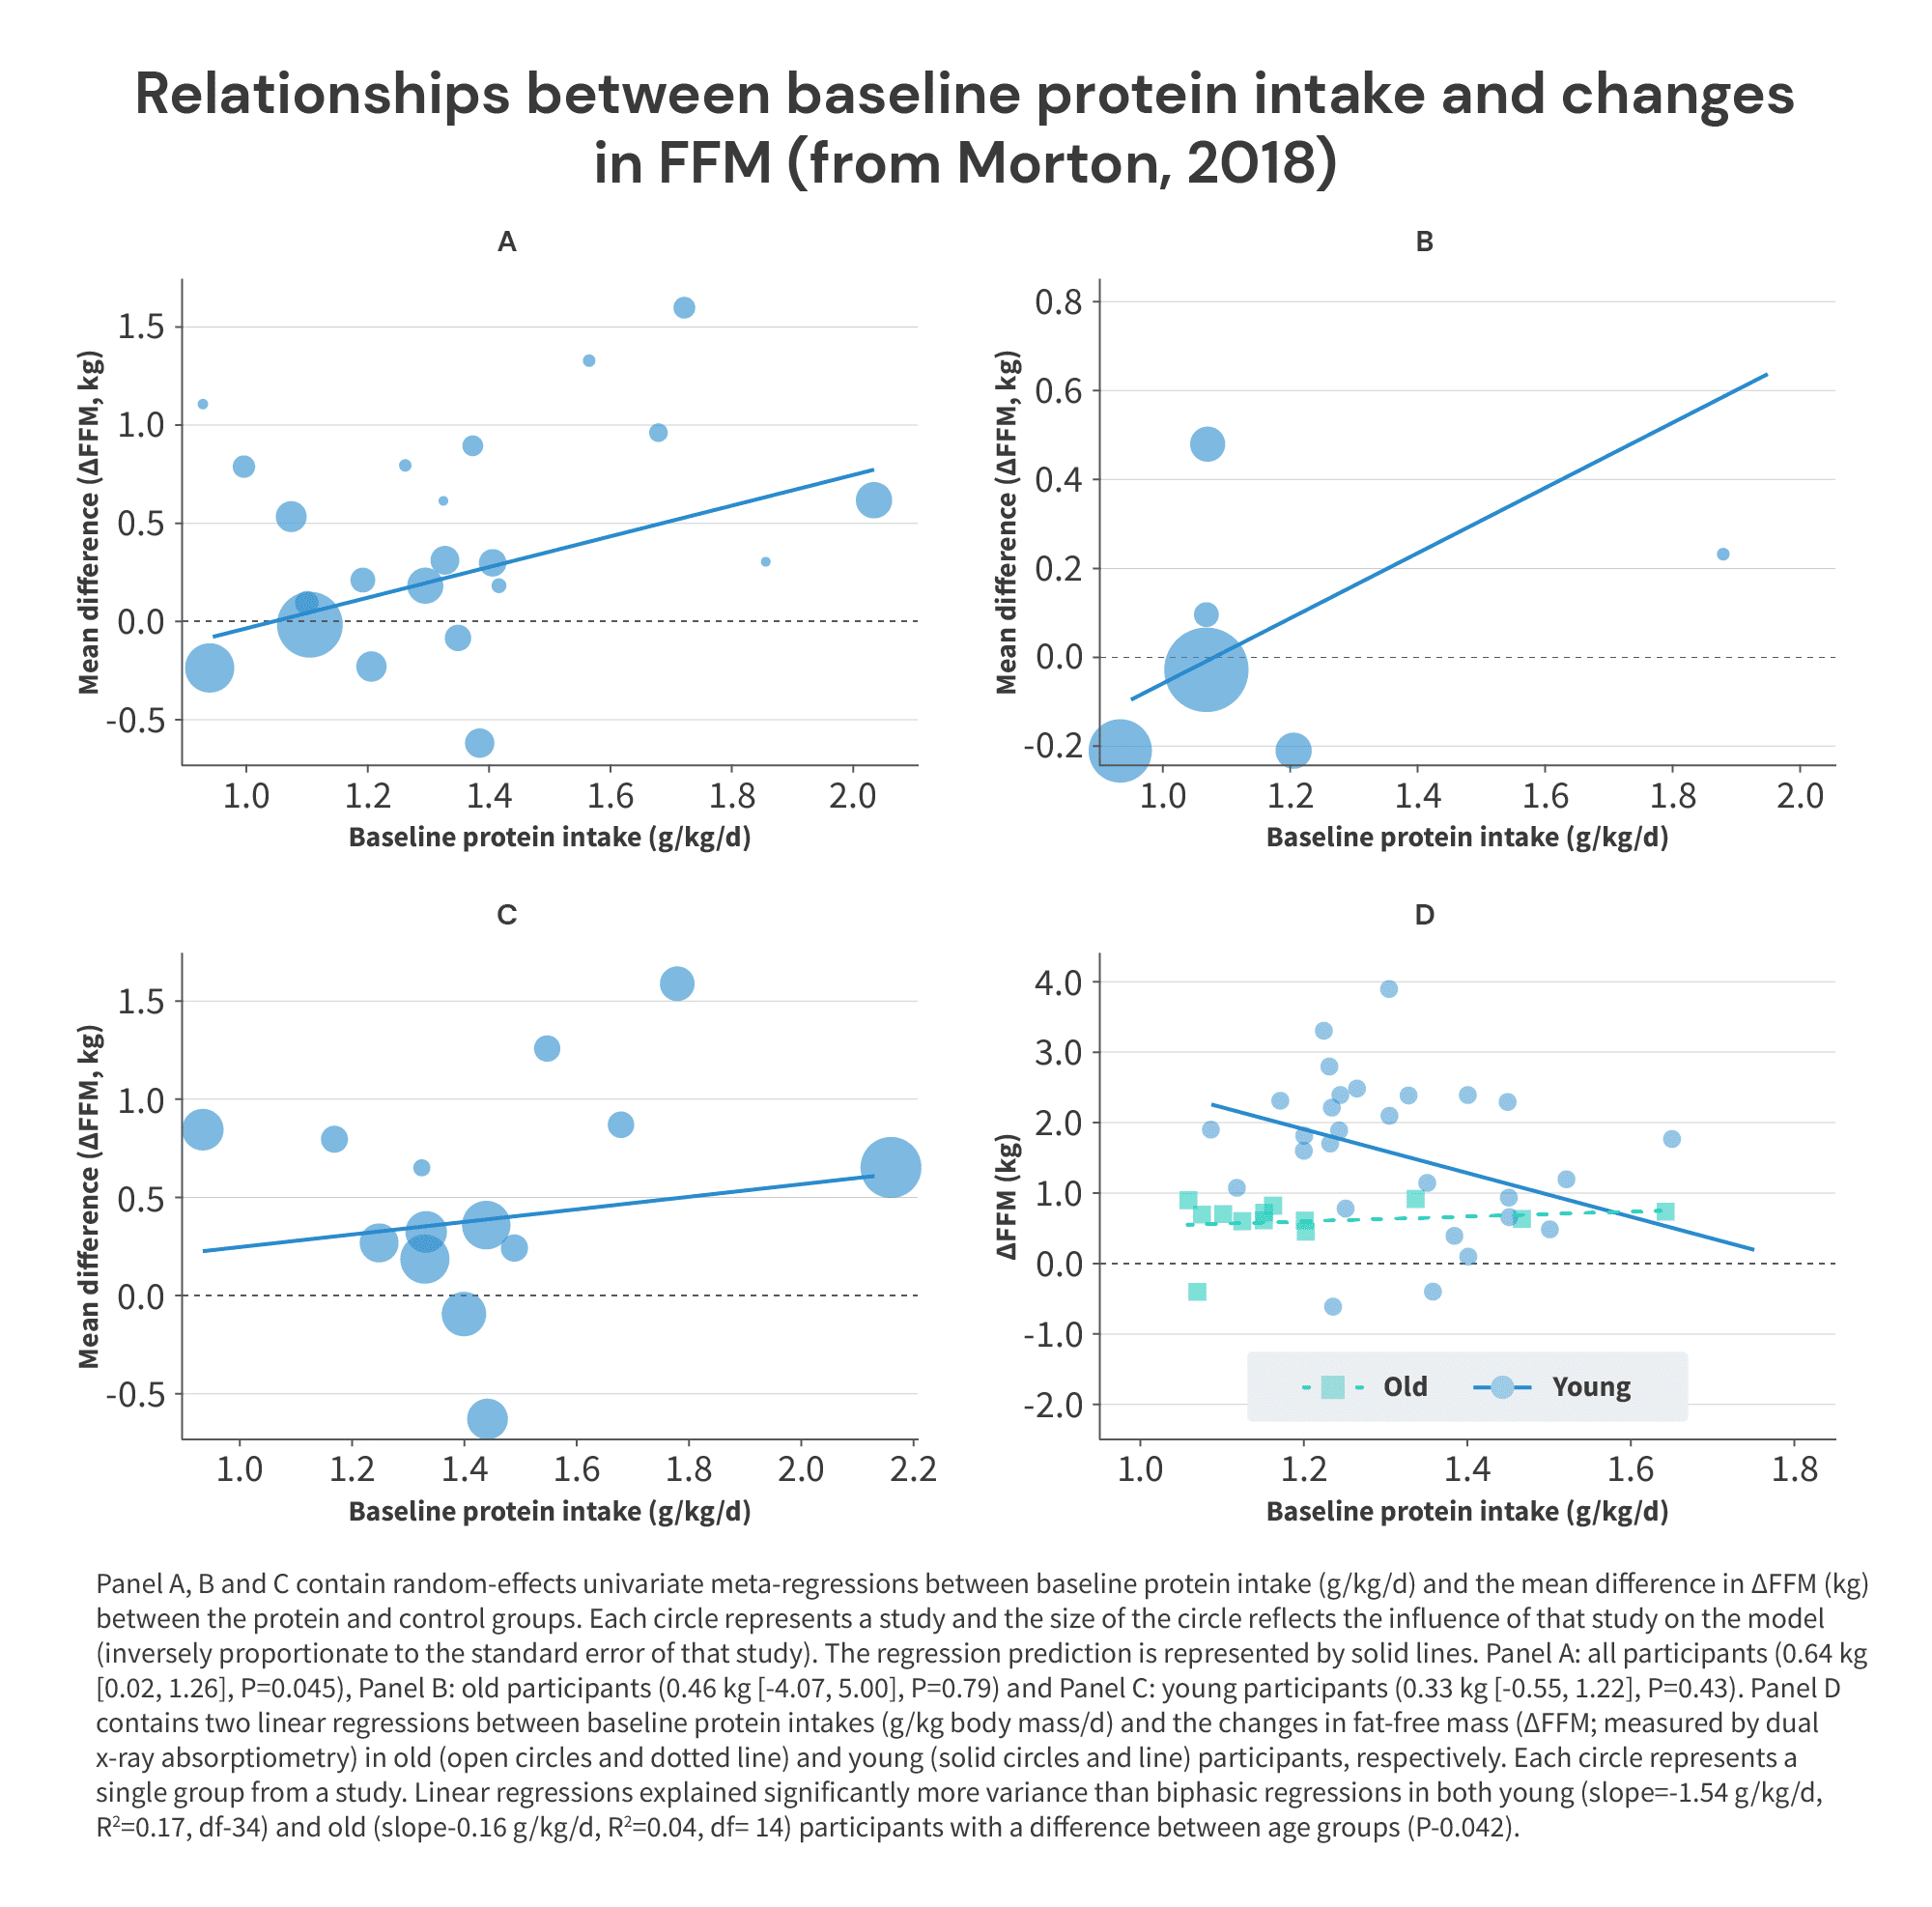

I realize there’s a lot going on in these figures, but they’re pretty straightforward. Figures A-C plot baseline protein intake on the x-axis, and the difference in FFM gains between groups receiving versus not receiving protein supplementation on the y-axis.
So, imagine you have a pool of subjects consuming 1.2g/kg of protein at baseline. Half of the subjects receive a protein supplement to increase their protein intake to 1.5g/kg, while the other half of the subjects serve as a control group and continue consuming 1.2g/kg. At the end of the study, the subjects in the supplementation group gain 1.4kg of fat-free mass, and the subjects in the control group gain 1.0kg of fat-free mass. With these results, you’d plot the point (1.2,0.4). That point would tell you that baseline protein intake was 1.2g/kg, and adding supplemental protein on top of the baseline intake of 1.2g/kg led to an additional 0.4kg increase in FFM, compared to not increasing protein intake.
Now, if protein intakes above 1.62g/kg didn’t lead to further increases in fat-free mass, what should we expect to see in these figures?
We should expect to see that low x-values (low baseline protein intakes) correspond to higher y-values (larger benefits from increasing protein intake), and that x-values above ~1.62g/kg correspond to y-values of ~0 (meaning that increasing protein intake above a baseline intake of 1.62g/kg fails to lead to further gains in FFM). In other words, we should see a chart with a trend that looks something like this:
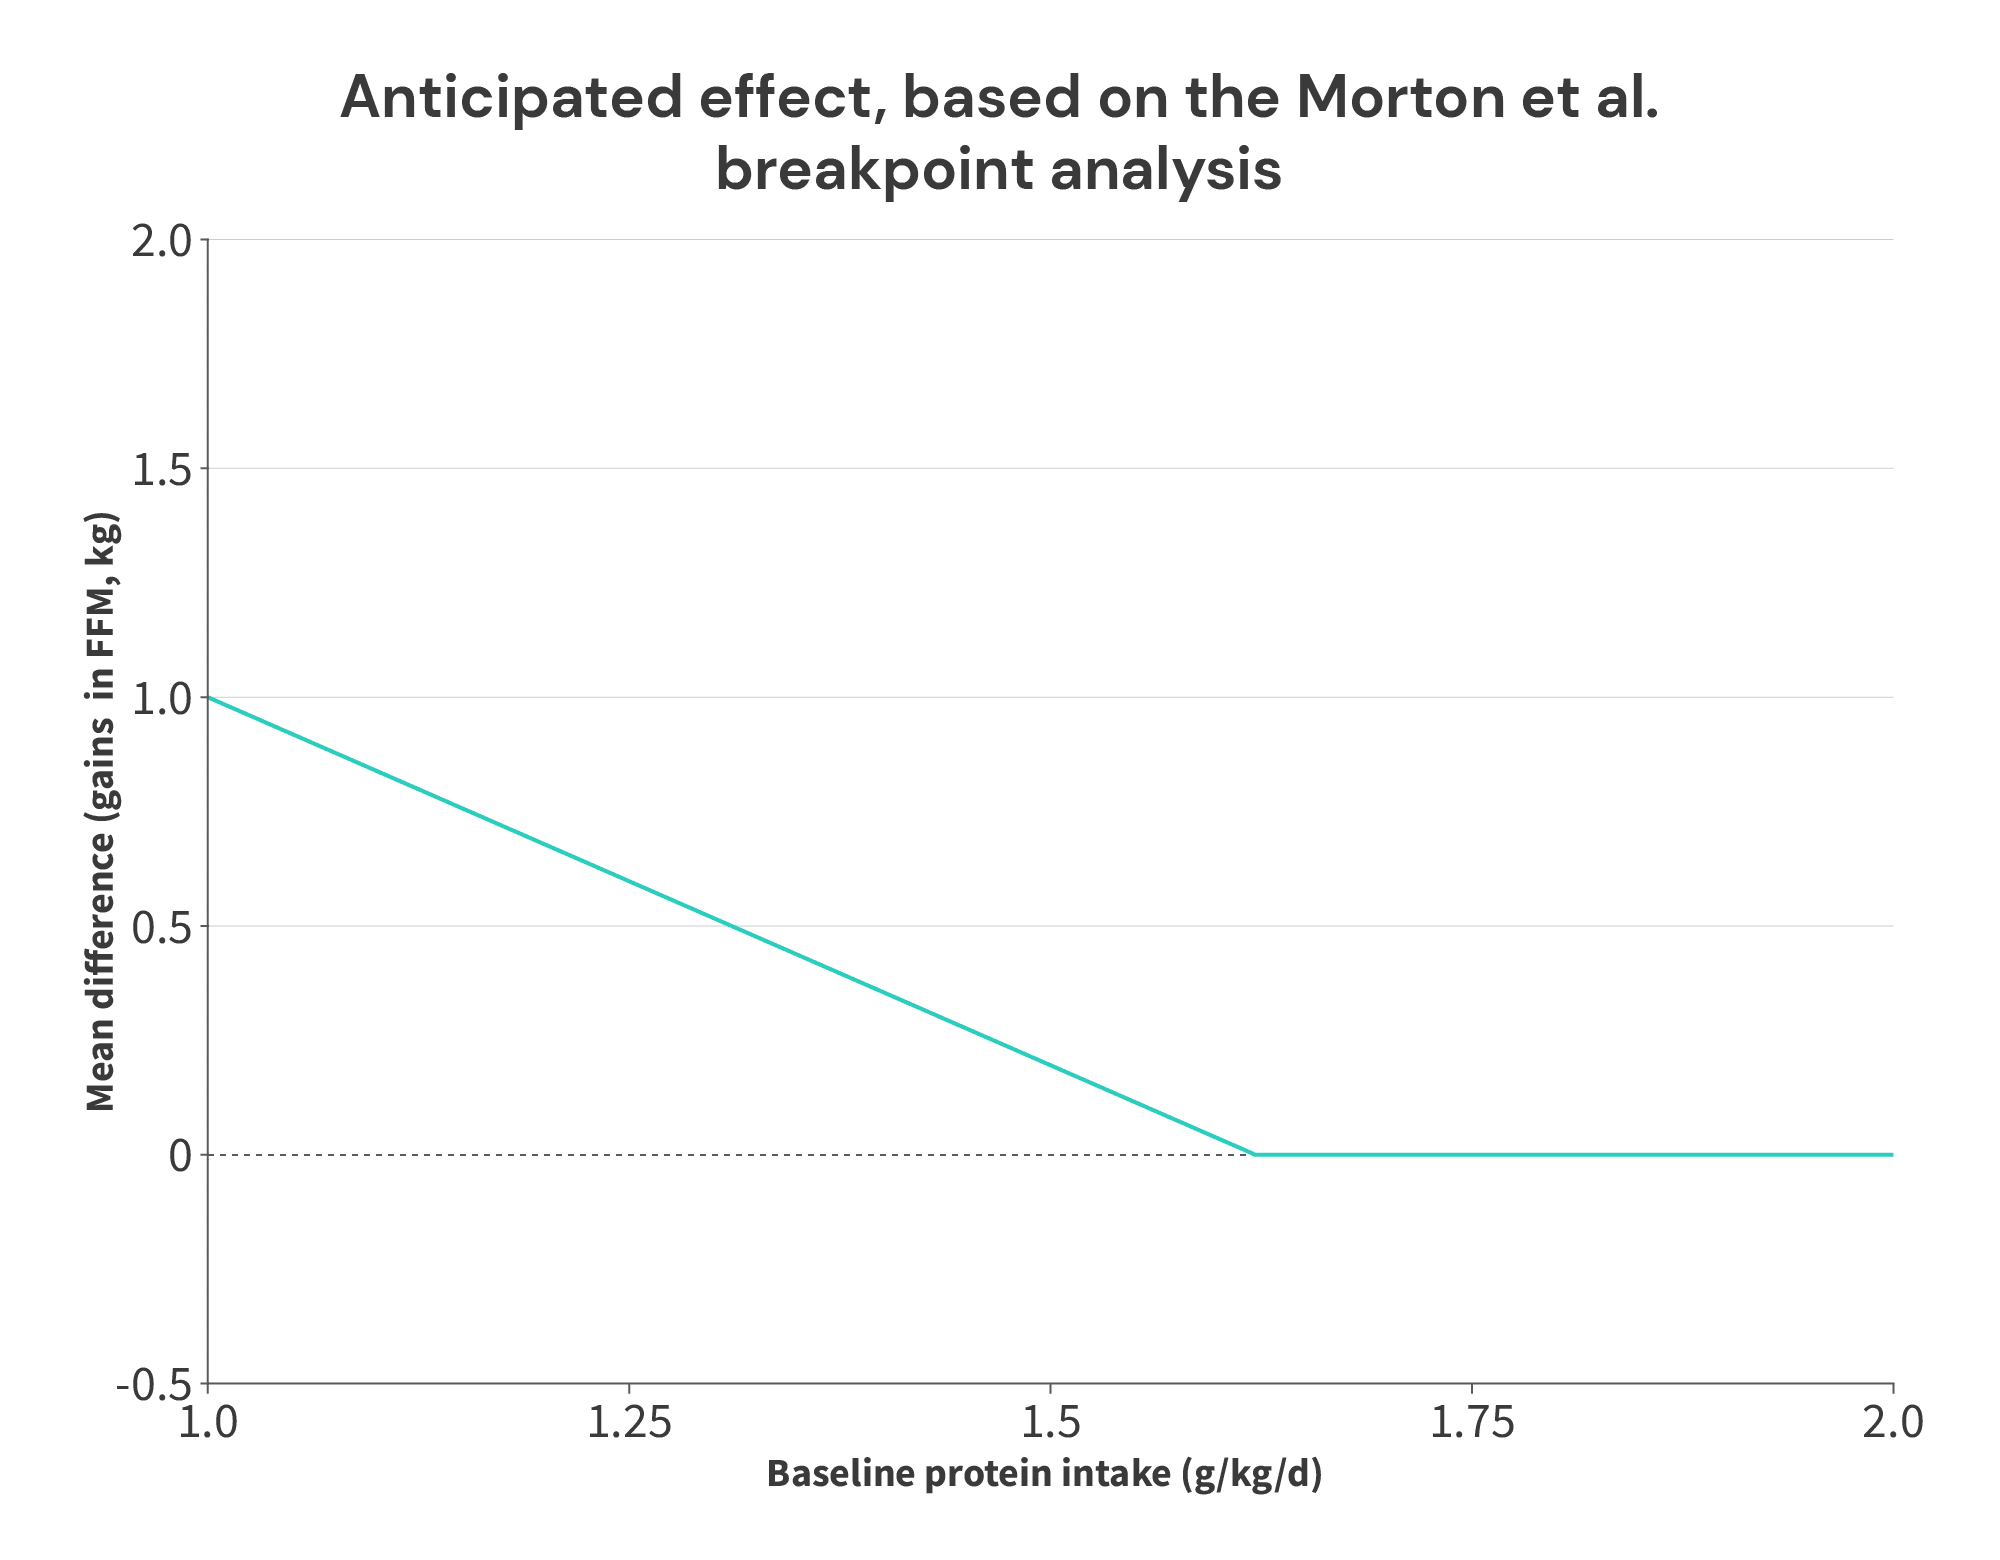

Basically, if the positive impact of protein on FFM accretion plateaus at an intake of 1.62g/kg, you should expect that increases in protein intake beyond that point shouldn’t lead to larger gains in FFM. So, if a group is already consuming 1.62g/kg, and they further increase their protein intake, this additional increase shouldn’t lead to larger increases in FFM (compared to another group that continues to consume 1.62g/kg).
However, that’s not what we see in Supplementary Figure 3. Instead, we tend to observe that higher baseline protein intakes are associated with slightly larger benefits from additional protein intake. Now, I wouldn’t put too much stock in the overall positive associations seen in graphs A-C – when decomposed by age (graphs B and C), the associations are weak and nonsignificant (p > 0.4). But, these relationships are distinctly not the overall negative relationships one should expect if there was truly a breakpoint at 1.62g/kg. And, notably, in all five instances where subjects were consuming near or above 1.6g/kg of protein at baseline, further increases in protein intake uniformly led to further increases in FFM:
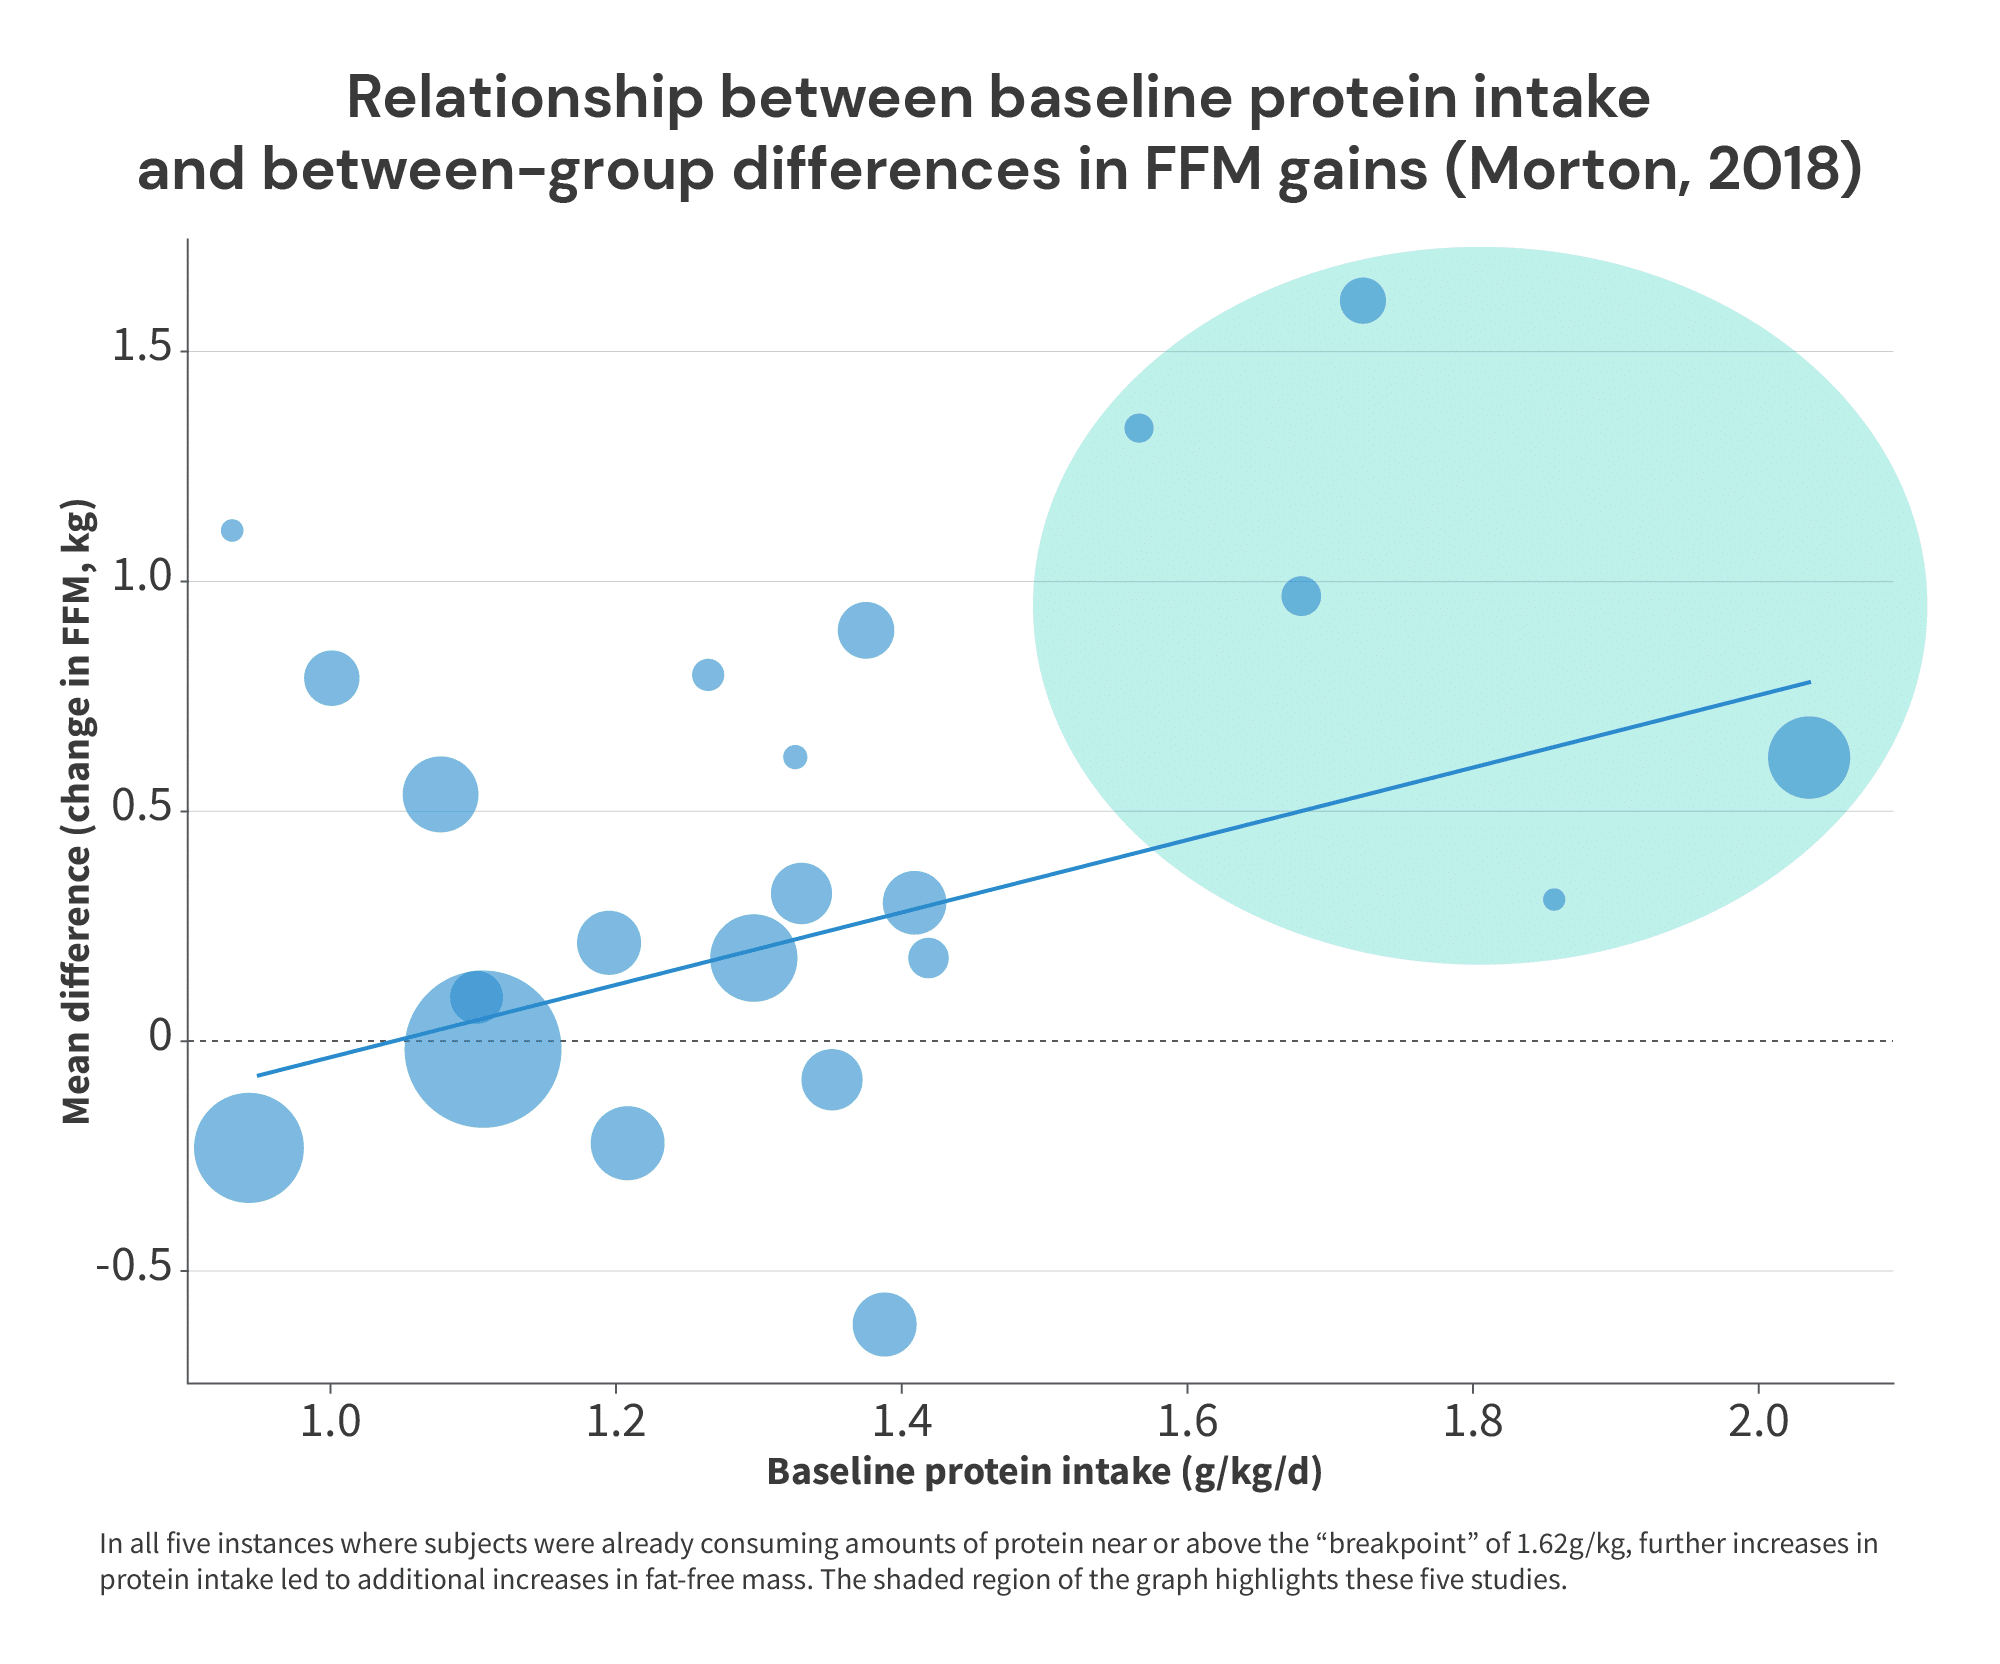

So, this leaves us with a bit of a mystery: the data presented in this figure seems to conflict with the breakpoint analysis presented above. How can both analyses be accurate?
Fortunately, there’s an easy explanation: higher baseline protein intakes were slightly negatively associated with gains in fat-free mass (especially in younger subjects), as you can see in graph D above.
I think what we’re dealing with here is an example of Simpson’s Paradox. In essence, Simpson’s Paradox is the name given to the phenomenon that occurs when trends that arise when analyzing data on one level conflict with trends that arise when analyzing the data on another level.
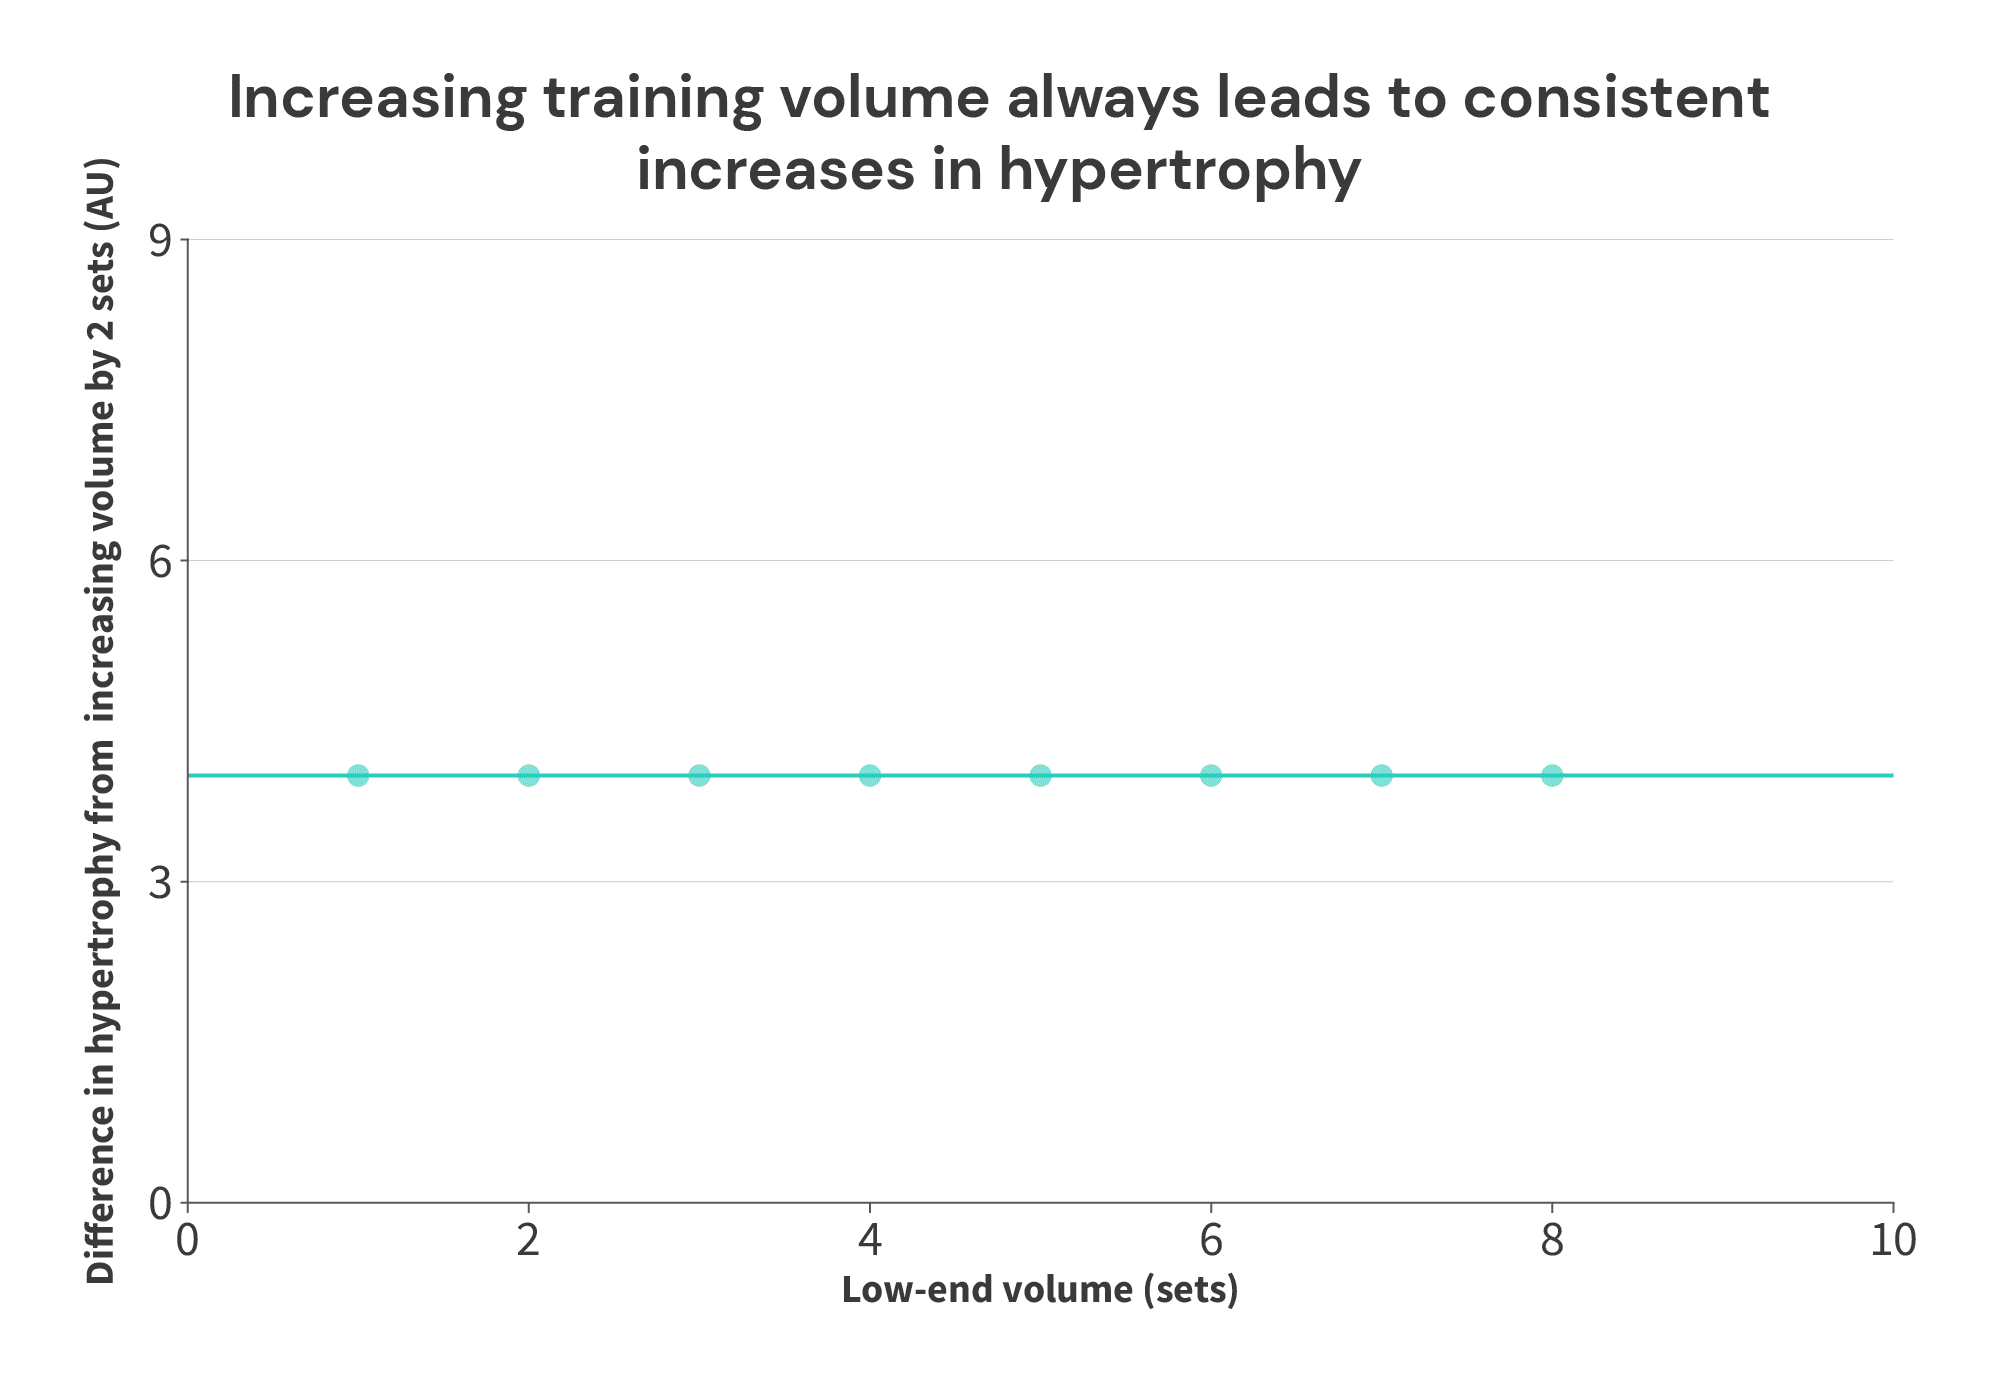
Here’s a simple illustration: let’s assume we have this set of 8 theoretical studies, investigating the impact of training volume on muscle growth.


In all cases, 2 additional sets yield 4 additional units of hypertrophy. Seems simple enough, right? More training volume yields more growth. We can express this graphically below, much like Supplementary Figure 3 A-C from the Morton meta-analysis.

However, things look quite a bit different if we just make a graph of the volume performed in each group, versus the hypertrophy achieved in each group (more similar to the breakpoint analysis in the Morton meta-regression):
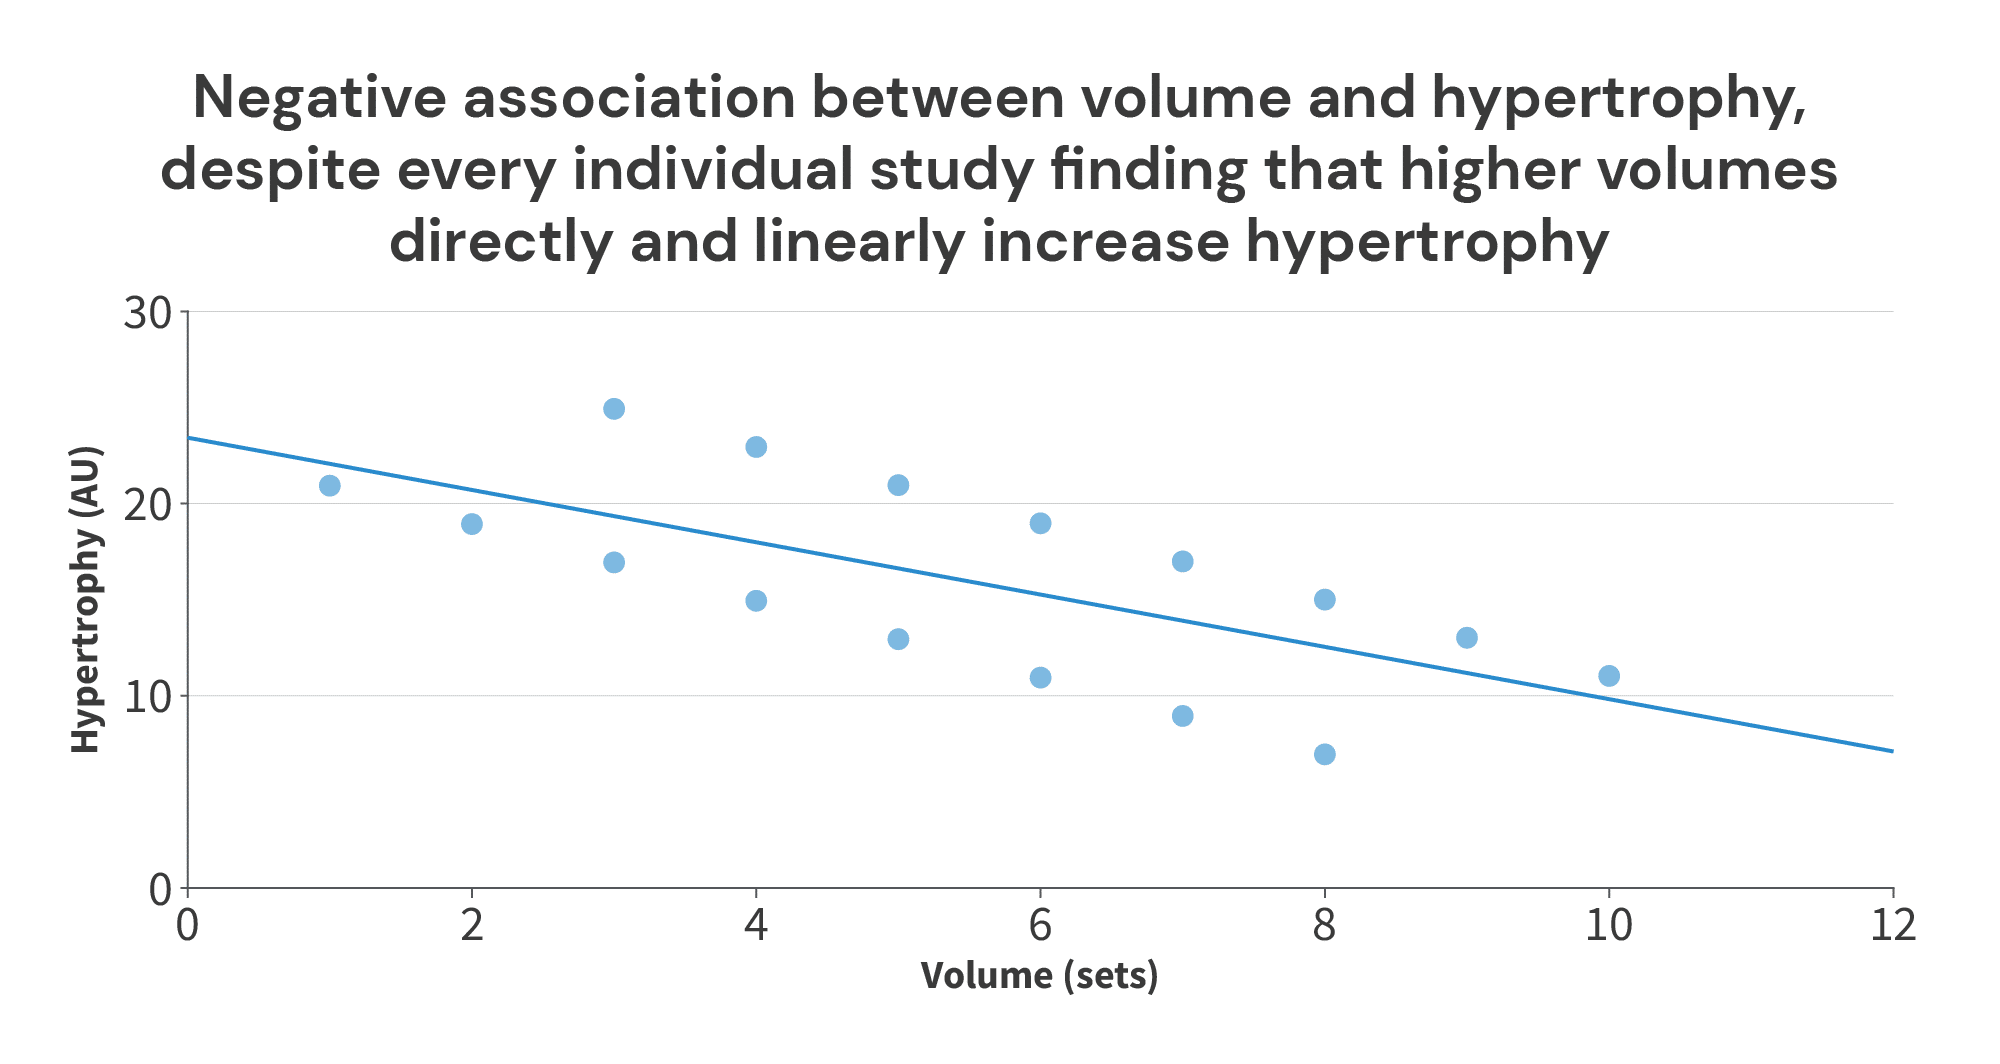

So, in this case, if you’re currently doing 8 sets, what training adjustment do you think is most likely to lead to more muscle growth? Do you think you’d be more likely to improve your results by increasing your training volume to 10 sets per week? Or do you think you’d be more likely to improve your results by decreasing your training volume to 3 sets per week?
I think I (and most other people) would recommend increasing training volume to 10 sets per week.
But, why might a relationship like this (different results when you compare results within studies versus comparing results between studies) arise in the first place?
Most frequently, it’s because subject characteristics differ between groups or studies, and those differences in subject characteristics lead to differences in average outcomes, even if the impact of the intervention doesn’t change. For example, in this volume/hypertrophy illustration, maybe the studies were ordered by training status (with untrained subjects in Study 1, and elite bodybuilders in Study 8). The study that assigned the lowest training volumes (Study 1 – 1 vs. 3 sets) was also the study where you’d expect to see the greatest overall growth, regardless of training volume, and the study that assigned the highest training volumes (Study 8 – 8 vs. 10 sets) was also the study where you’d expect to see the least overall growth, regardless of training volume. So, the overall negative relationship between volume and hypertrophy in the figure above is driven by differences in subject characteristics, not by differences in training volume. Regardless of subject characteristics, the intervention itself yielded the same effect (increasing training volume increased muscle growth).
Now, real data is never as clean as the illustrative data above, but I do think this type of dynamic is the main thing contributing to the appearance of a breakpoint in the Morton meta-regression. Most of the studies (39 out of 49) included in any of the analyses in the paper used untrained participants, and the studies that did use trained participants tended to have pretty high protein intakes, even in the groups that didn’t increase their protein intake.
To illustrate, the “simple” meta-analysis (just looking at whether protein supplementation leads to further increases in fat-free mass, disregarding any dose-response relationship) included four studies on trained lifters: Cribb (2007), Hoffman (2007), Hoffman (2009), and Kerksick (2006).
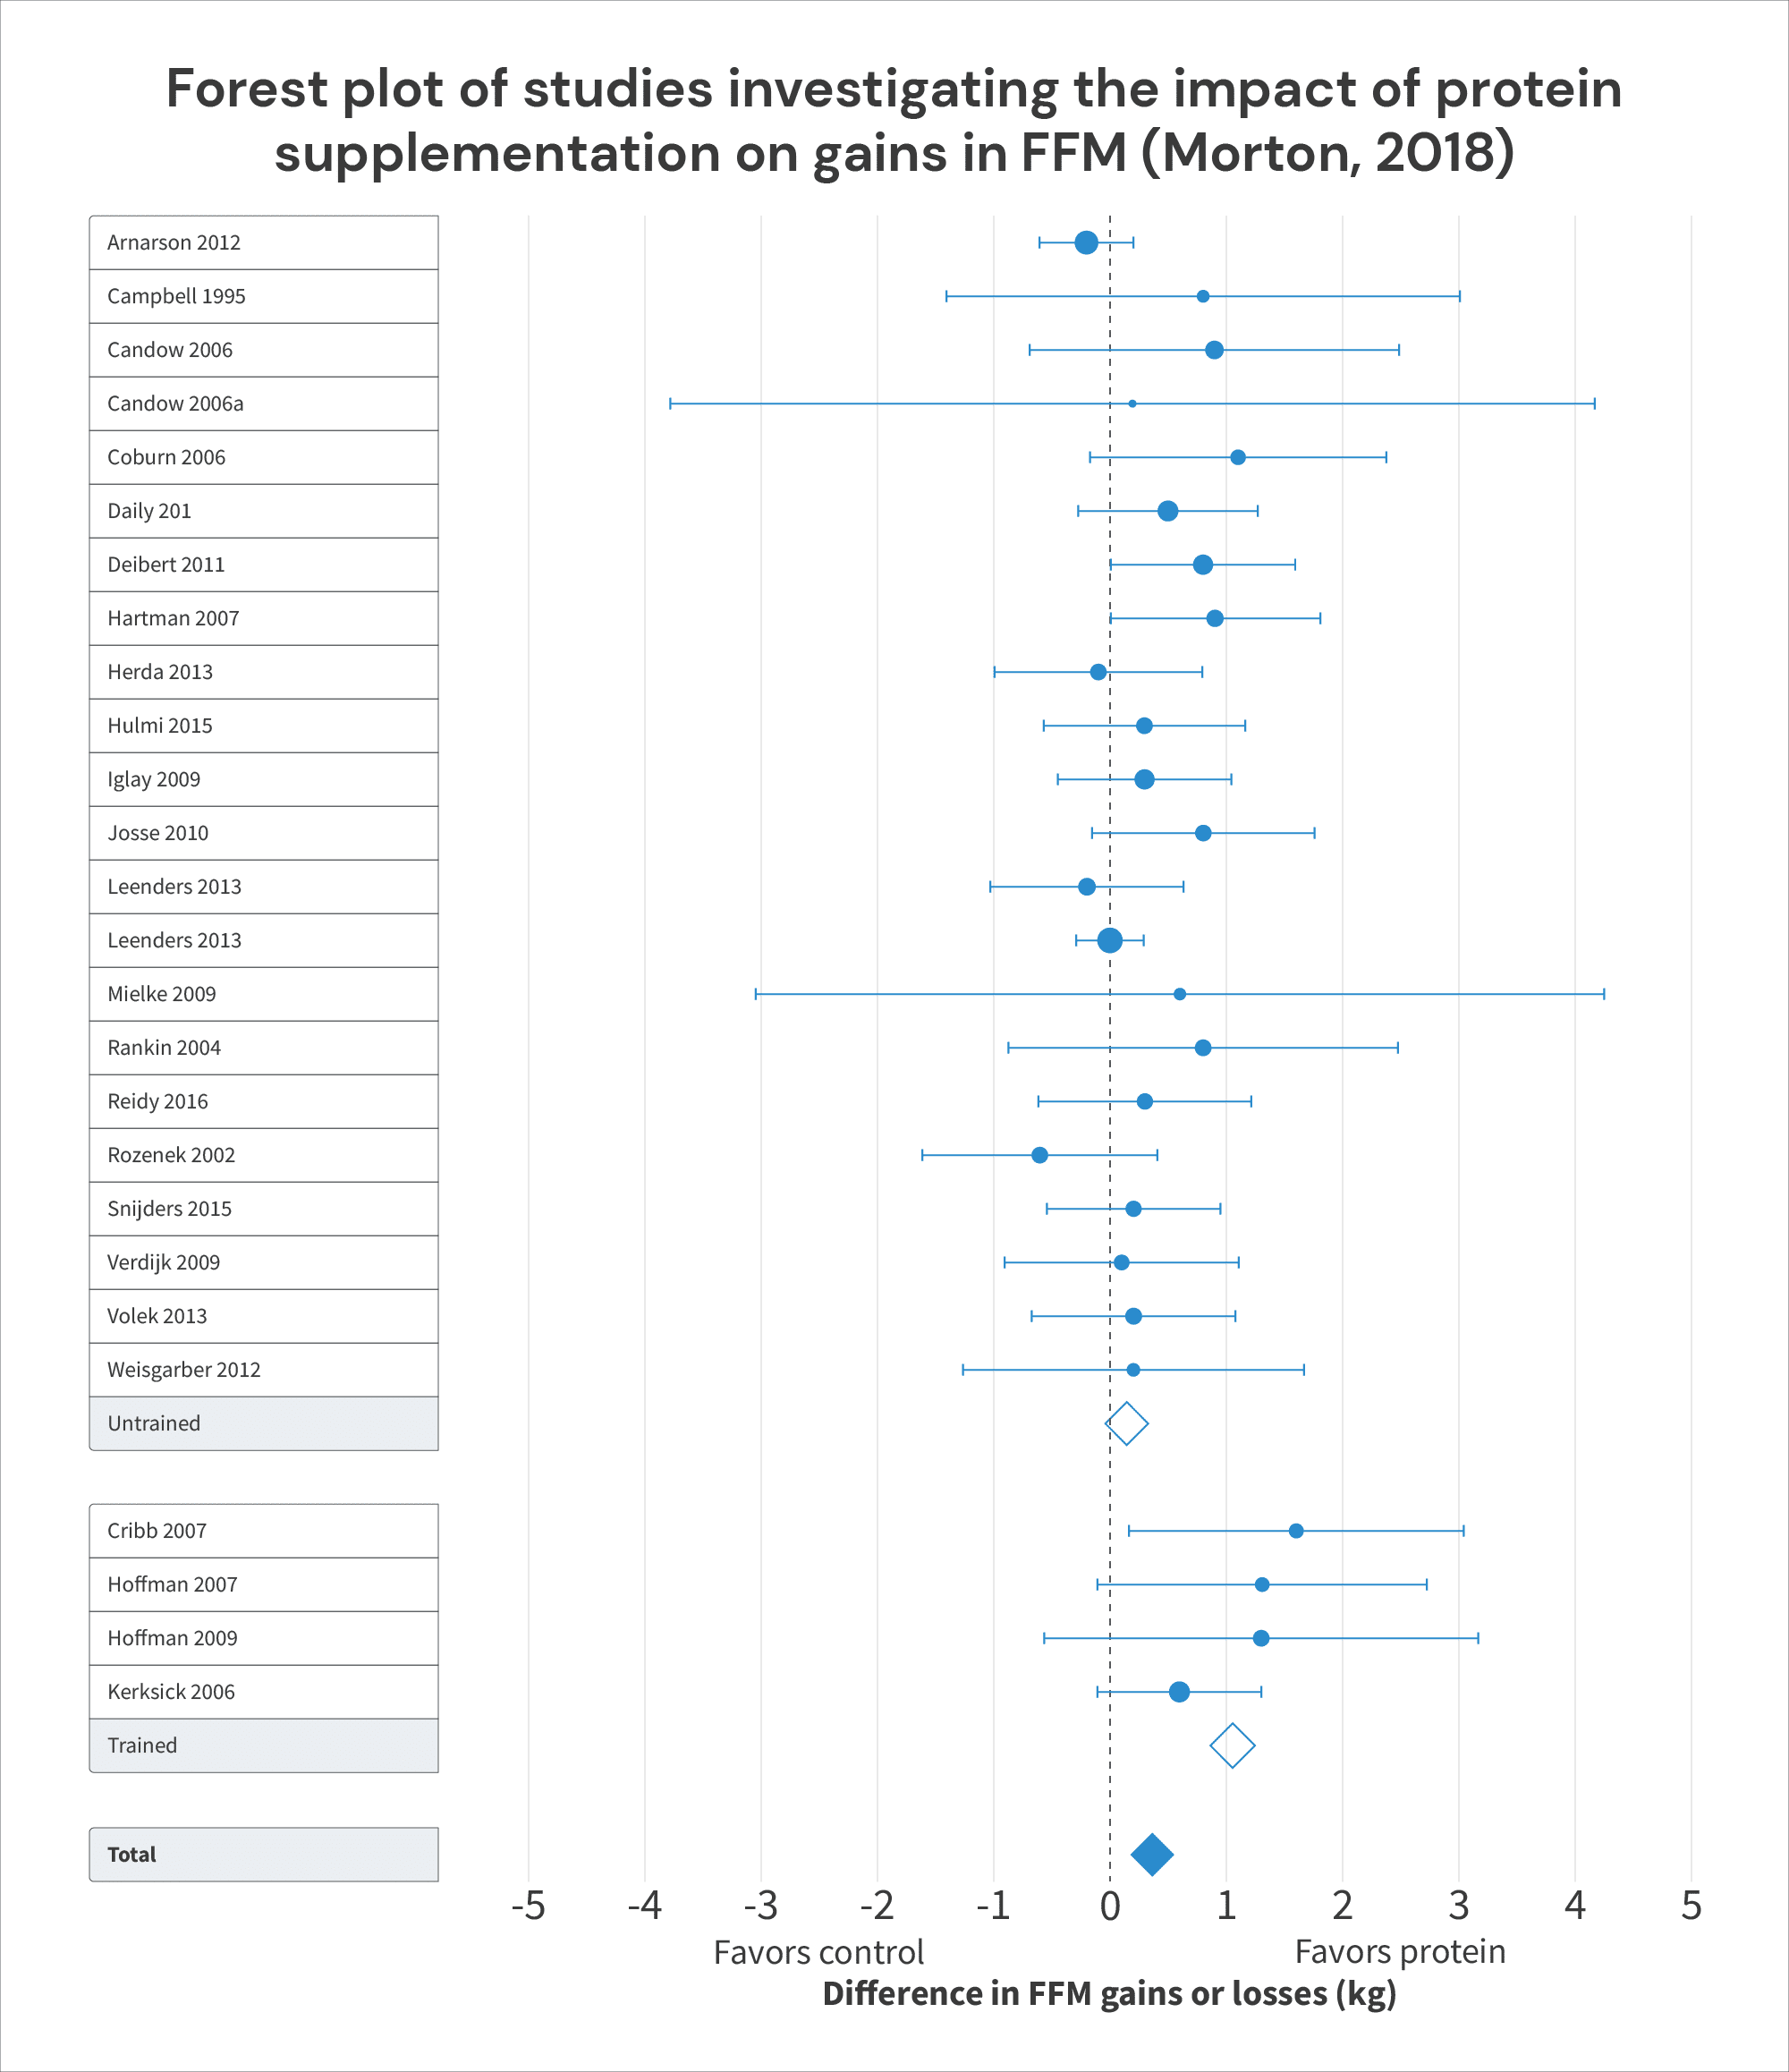

All four of these studies found that increasing protein intakes tended to also lead to larger increases in FFM. The pooled effect of increasing protein intake in these studies was an additional 1.05kg of FFM (95% CI = 0.61-1.50; p < 0.0001), which was considerably larger than the (non-significant) effect observed in untrained lifters, who only gained an additional 0.15kg (95% CI = -0.02 -0.31kg; p = 0.08) with increased protein intake. This led the researchers to conclude that “Protein supplement is more effective at improving FFM in … resistance-trained individuals than in … untrained individuals.”
However, in three of these four studies, protein intakes in the control groups were already near or above the “breakpoint” of 1.62g/kg: the control groups consumed around 1.63g/kg in Cribb, 1.63g/kg in Hoffman (2009), and 1.58g/kg in Kerksick. Furthermore, in all three of these studies, the control groups didn’t gain much fat-free mass (0.7kg in Cribb, 0.4kg in Hoffman, and 0.1kg in Kerksick), but the experimental groups did (2.3kg in Cribb, 1.65kg in Hoffman, and 1.8kg in Kerksick):
| Impact of protein supplementation on gains in FFM in trained subjects (from Morton, 2018) | ||||
| Study | Control group | Experimental group | Difference in FFM or LBM gained (kg) | |
| Cribb, 2007 | Protein intake (g/kg) | 1.63 | 2.92 | |
| Change in FFM or LBM (kg) | 0.7 | 2.3 | 1.6 | |
| Hoffman, 2007 | Protein intake (g/kg) | 1.24 | 2 | |
| Change in FFM or LBM (kg) | 0.1 | 1.4 | 1.3 | |
| Hoffman, 2009 | Protein intake (g/kg) | 1.63 | 2.22 | |
| Change in FFM or LBM (kg) | 0.4 | 1.65 | 1.25 | |
| Kerksick, 2006 | Protein intake (g/kg) | 1.58 | 2.32 | |
| Change in FFM or LBM (kg) | 0.1 | 1.8 | 1.7 | |
When we plot the results from these studies on trained lifters, it doesn’t look like 1.62g/kg is where the beneficial effects of protein intake on trained lifters end. Rather, it looks like 1.62g/kg is much closer to the point at which they begin, as we observe fairly small gains in LBM or FFM at intakes around 1.6g/kg, and much larger gains as intakes exceed 2g/kg:
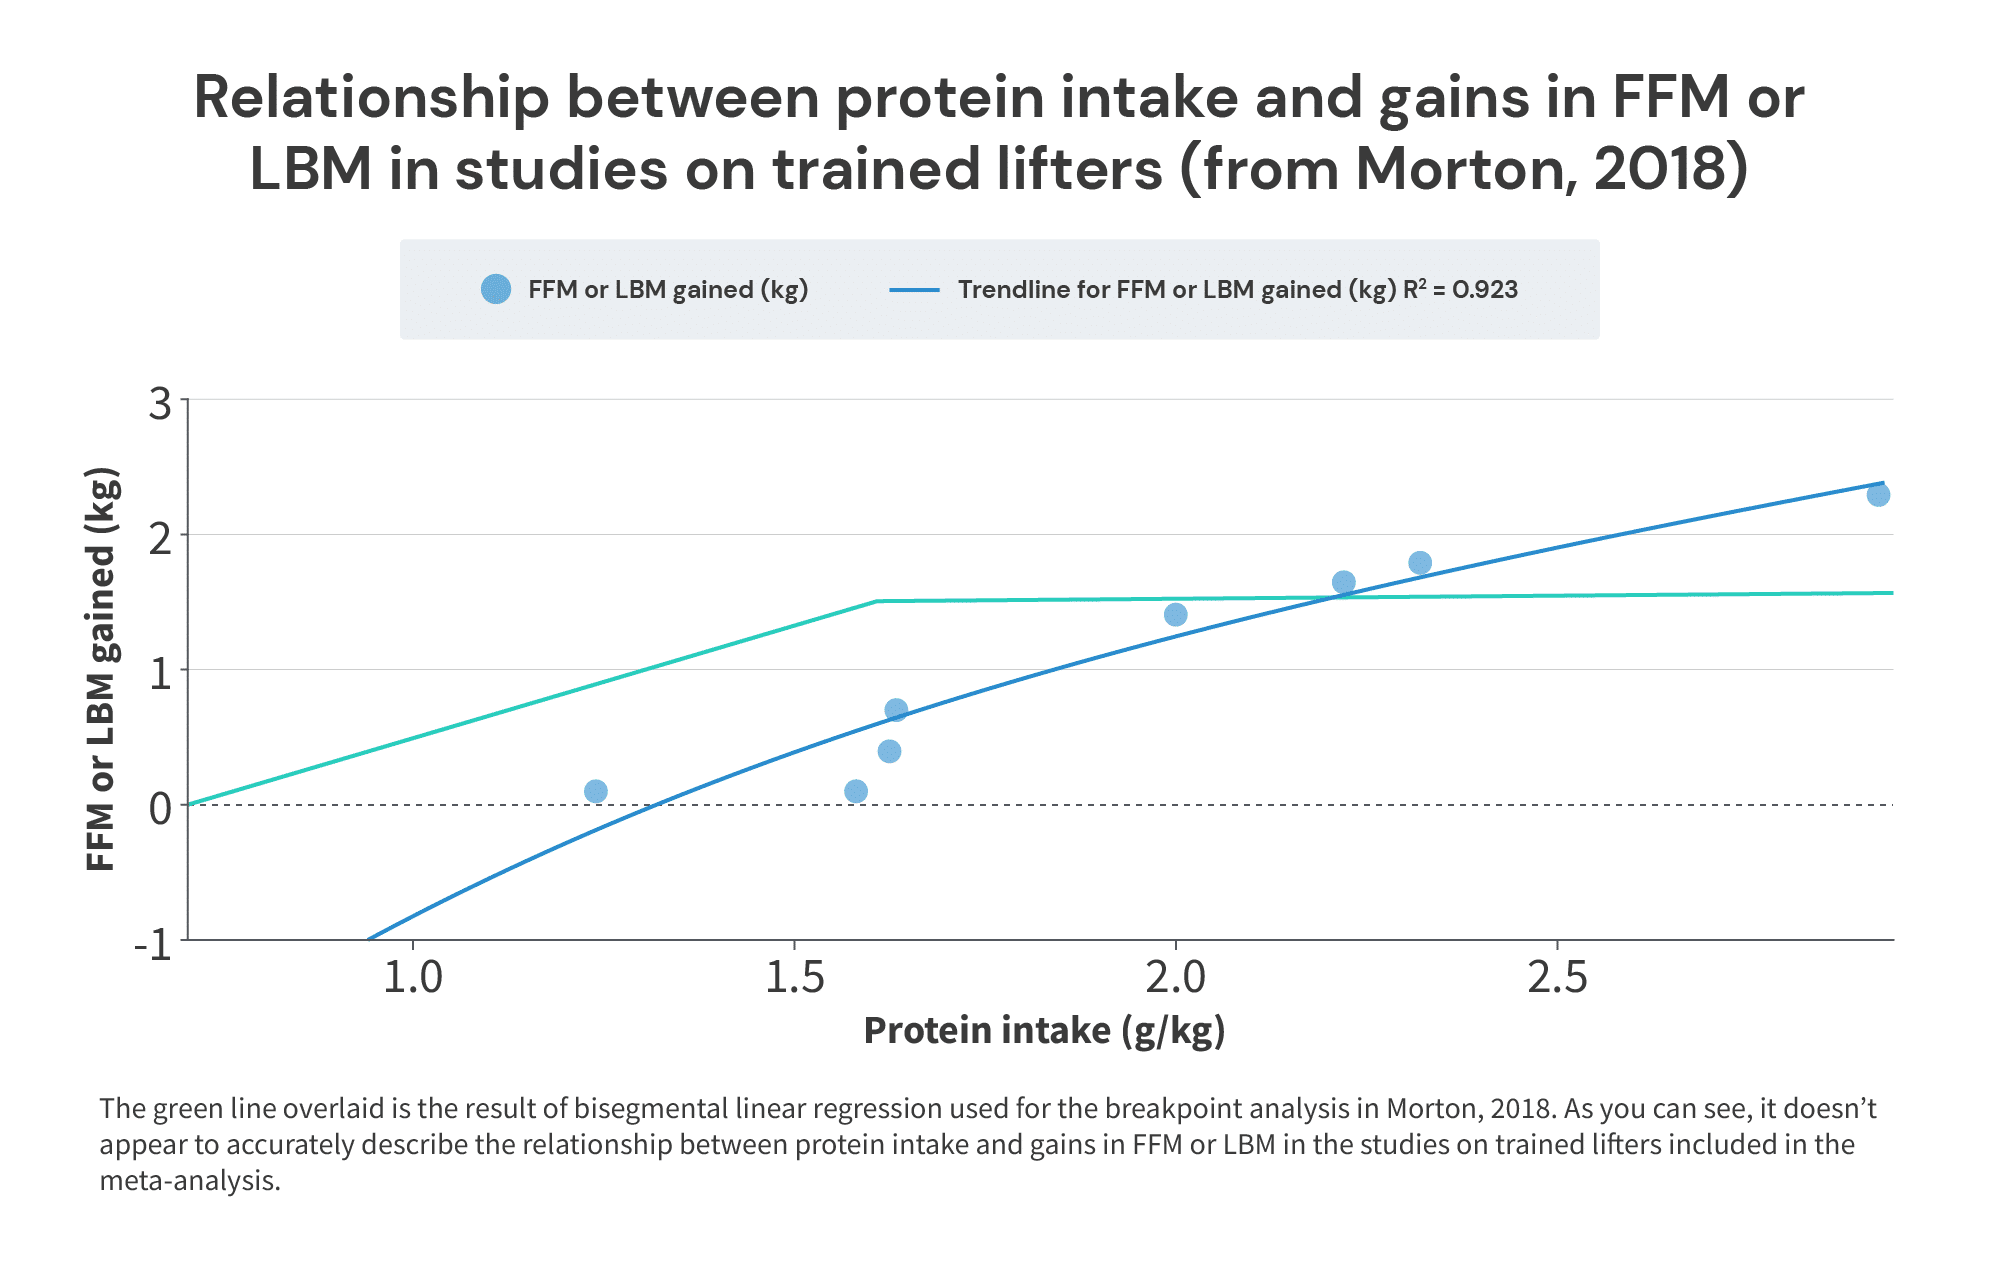

So, just to sum up this section: the meta-analysis people cite as strong evidence that lifters don’t need to consume more than 1.62 grams of protein per kilogram of body mass … doesn’t actually provide particularly strong evidence to support that claim. In fact, in all of the included studies where subjects started at (or above) 1.6g/kg, and then further increased their protein intake, those further increases in protein intake led to additional increases in FFM or LBM. I suspect this apparent divergence in the results of different analyses is due to some form of Simpson’s Paradox.
Furthermore, I suspect that differences in training status are the primary factor explaining the divergence: studies with trained lifters may be simultaneously more likely to:
a) observe smaller overall increases in FFM
b) test higher overall protein intakes (in both the experimental and control arms of the studies), and
c) still observe that increasing protein intakes (above 1.62g/kg) leads to further gains in FFM
Since 2018, a couple more big meta-regressions on the relationship between protein intake and gains in FFM/LBM have been published.
The first is from 2020, by Tagawa and colleagues. It had a few differences from the Morton meta-regressions.
- The biggest difference is that it analyzed studies both with and without a resistance training component. However, the researchers separated the lifters and non-lifters for their main analyses, allowing us to still see the relationship between protein intake and gains in FFM in lifters specifically.
- The researchers allowed weight loss studies to be included, unlike the Morton meta-regression (so, in effect, the Tagawa meta-regression was simultaneously analyzing the impact of protein intake on gaining fat-free mass when gaining or maintaining weight, and the impact of protein intake on preserving fat-free mass when losing weight).
- The researchers opted for a slightly different analytical approach. Instead of trying to find a specific breakpoint, they opted for a multivariate spline model. I like this decision in a vacuum (with a breakpoint analysis, you’re essentially baking in the assumption that the slope will equal zero past a certain point within your data. With splines, you can theoretically model the data better without baking in such a hard assumption that your data may not support), but the statistical reporting is a bit…sparse overall. This makes it a bit harder to poke around and see how well the models describe the underlying data.
Overall, it included 105 studies with 138 intervention groups and 5402 individuals. Of these, 53 studies included resistance training, with a total of 72 intervention groups and 2325 individuals.
In the studies on lifters, the results of the Tagawa meta-analysis suggest that … increasing protein intake increases gains in FFM or LBM. The researchers presented their results in three different ways. First, they presented an unadjusted model (not dissimilar to the analysis done for the breakpoint model in the Morton meta-regression). Second, they presented a model with statistical adjustments for age, sex, and intervention duration. Finally, they presented a model with all of the aforementioned adjustments, plus an additional adjustment for weight change.
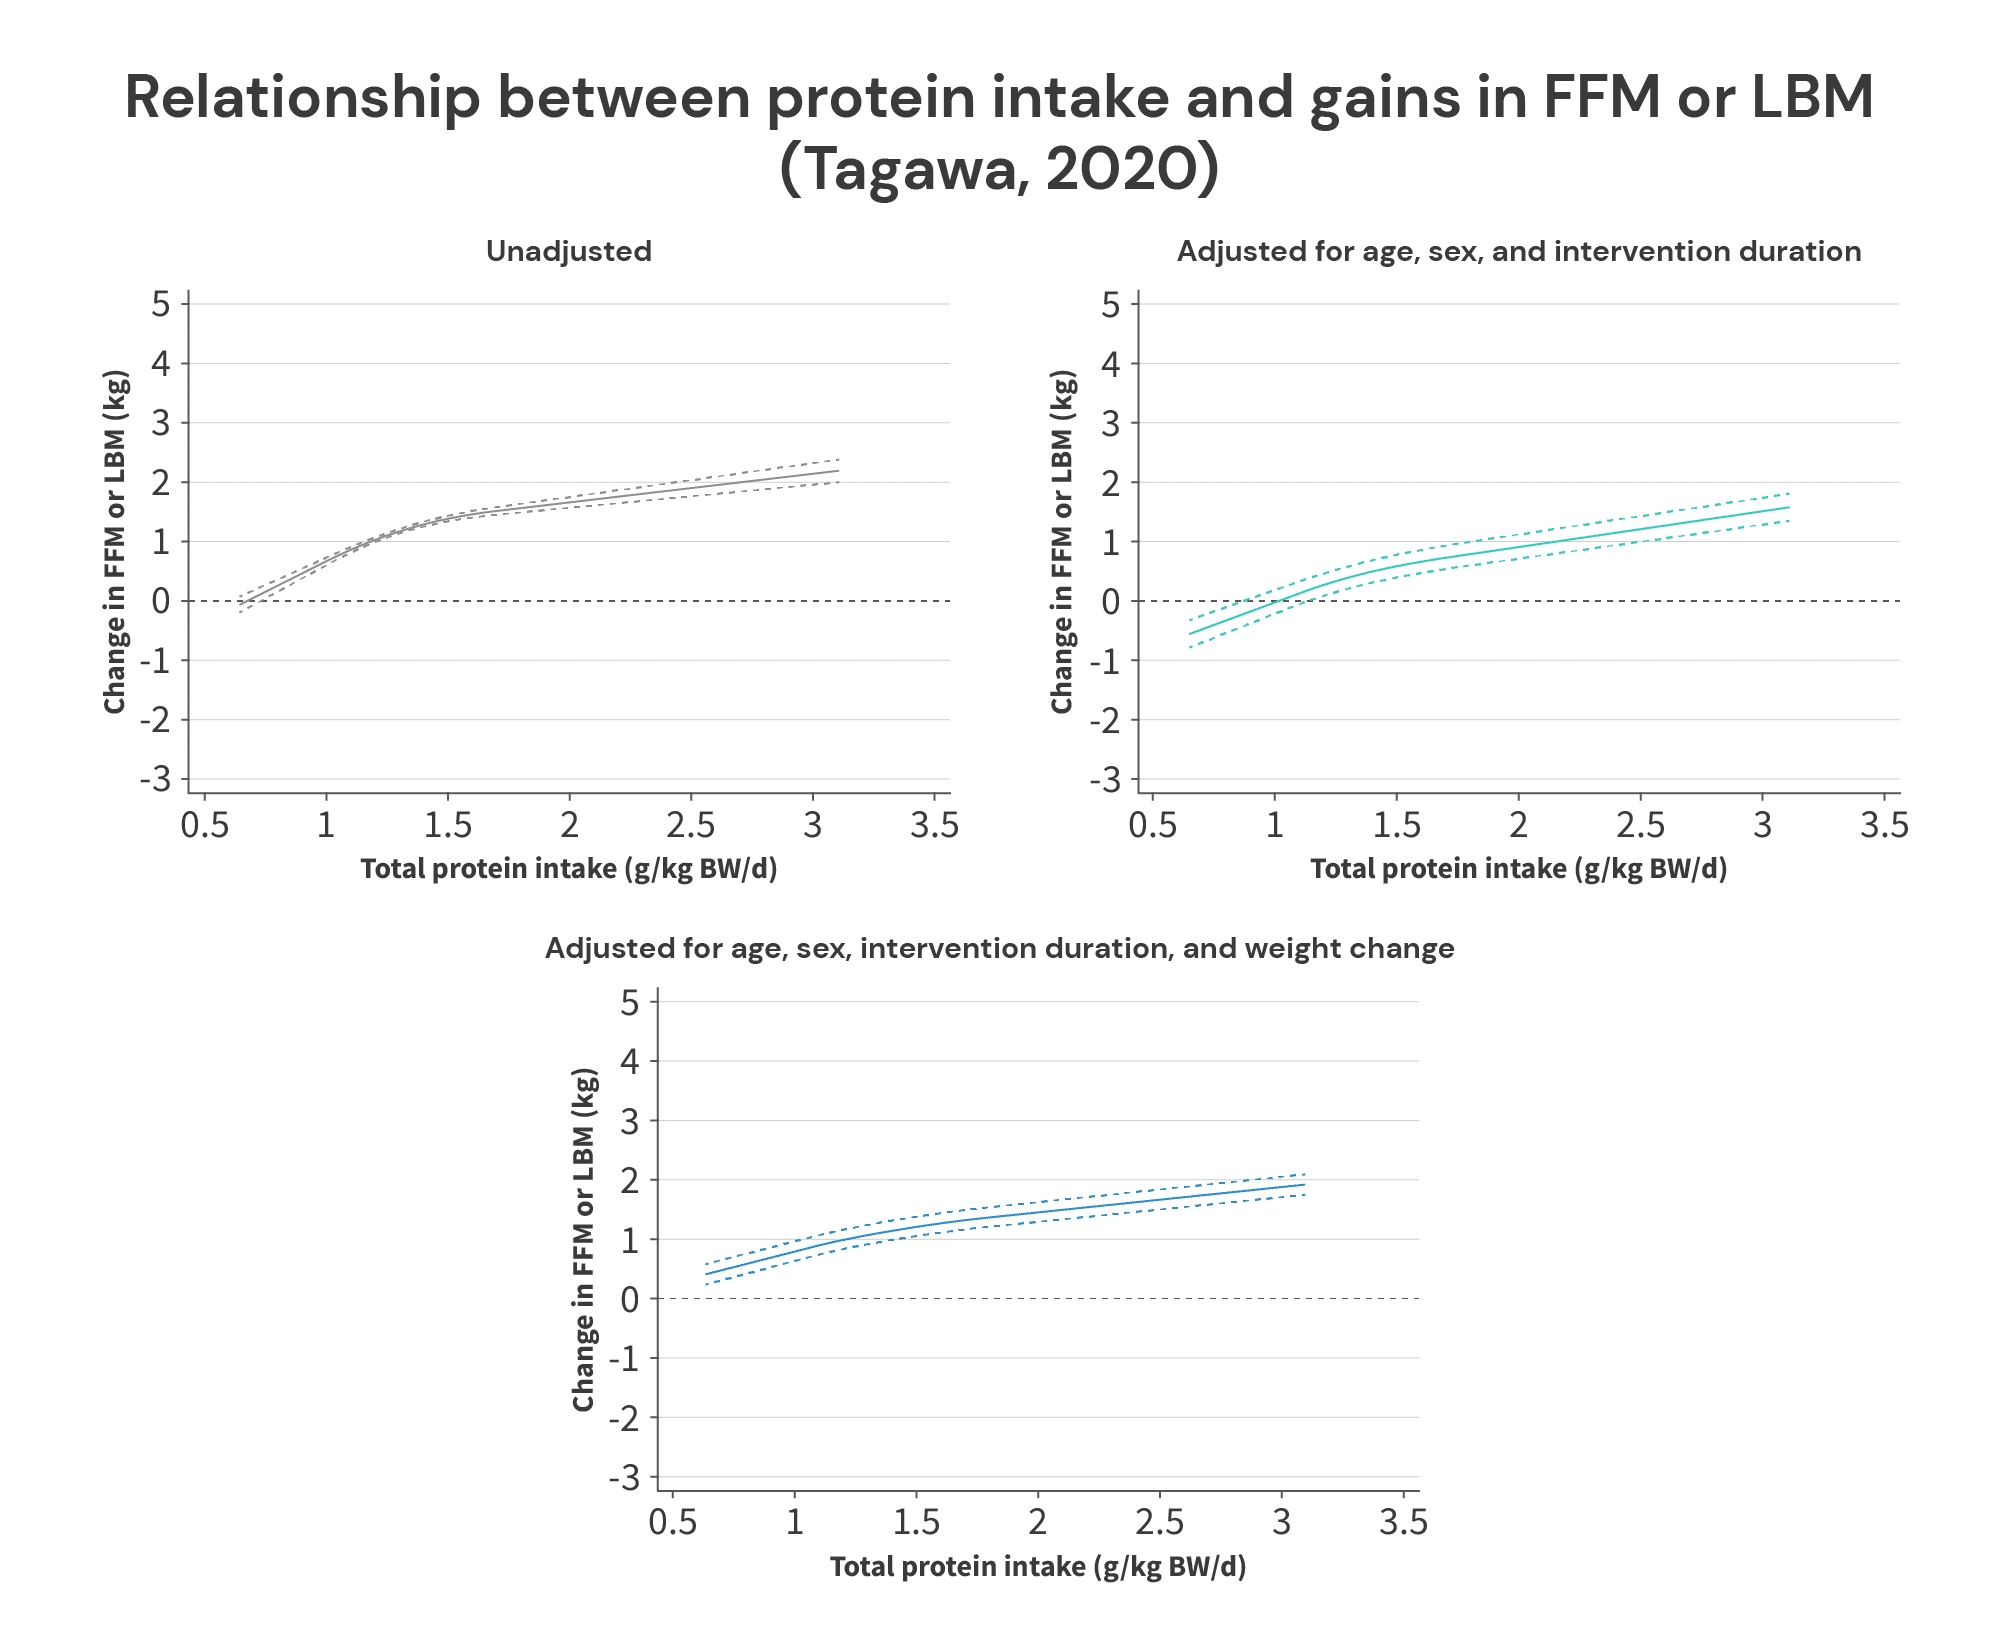

All of these models suggest that protein intakes exceeding 1.62g/kg lead to further increases in FFM or LBM, and none of the statistical adjustments affect them that much. All three models suggest that increases in protein intake up to about 1.3-1.5g/kg have a larger impact than increases in protein intake beyond about 1.5g/kg, but the slope remains positive up to intake levels of ~3g/kg (at which point, I assume the model “stops” because there weren’t enough studies with even higher protein intake levels to bother modeling).
I don’t have too much more to add about the Tagawa meta-regressions – they might be great, or they might leave a lot to be desired. Unfortunately, the researchers didn’t describe the statistical procedures in enough detail, or report enough supplementary analyses to know for sure.
However, I did just want to quickly clear up a misconception I’ve seen floating around about this meta-regression. I’ve seen people claim that weight loss studies strongly influenced its results, because most of the included studies were weight loss trials with aggressive energy deficits. However, I’m not sure where this idea came from, because it’s simply untrue. Out of the 105 studies included in the meta-regressions (including studies both with and without resistance training), 41 were weight loss studies, 2 were weight gain studies, and 62 did not include a purposeful weight gain or weight loss intervention. Furthermore, of the resistance training studies in particular, 9 study arms aimed for weight loss, 1 aimed for weight gain, and 62 study arms didn’t include a purposeful weight gain or weight loss intervention. So, about 86% were maintenance studies, and only 12.5% were weight loss studies. This is reflected in the graphs above: adjustments for changes in body weight had minimal impact on the meta-regression line for the analyses in lifters.
Finally, the most recent meta-analysis and meta-regression is from Nunes and colleagues, published in 2022. This one had inclusion criteria that were similar to the Morton meta-regression from 2018 (healthy adults, no weight loss interventions, etc.). It included 66 studies investigating the impact of protein intake on LBM or FFM, with a total of 2665 subjects.
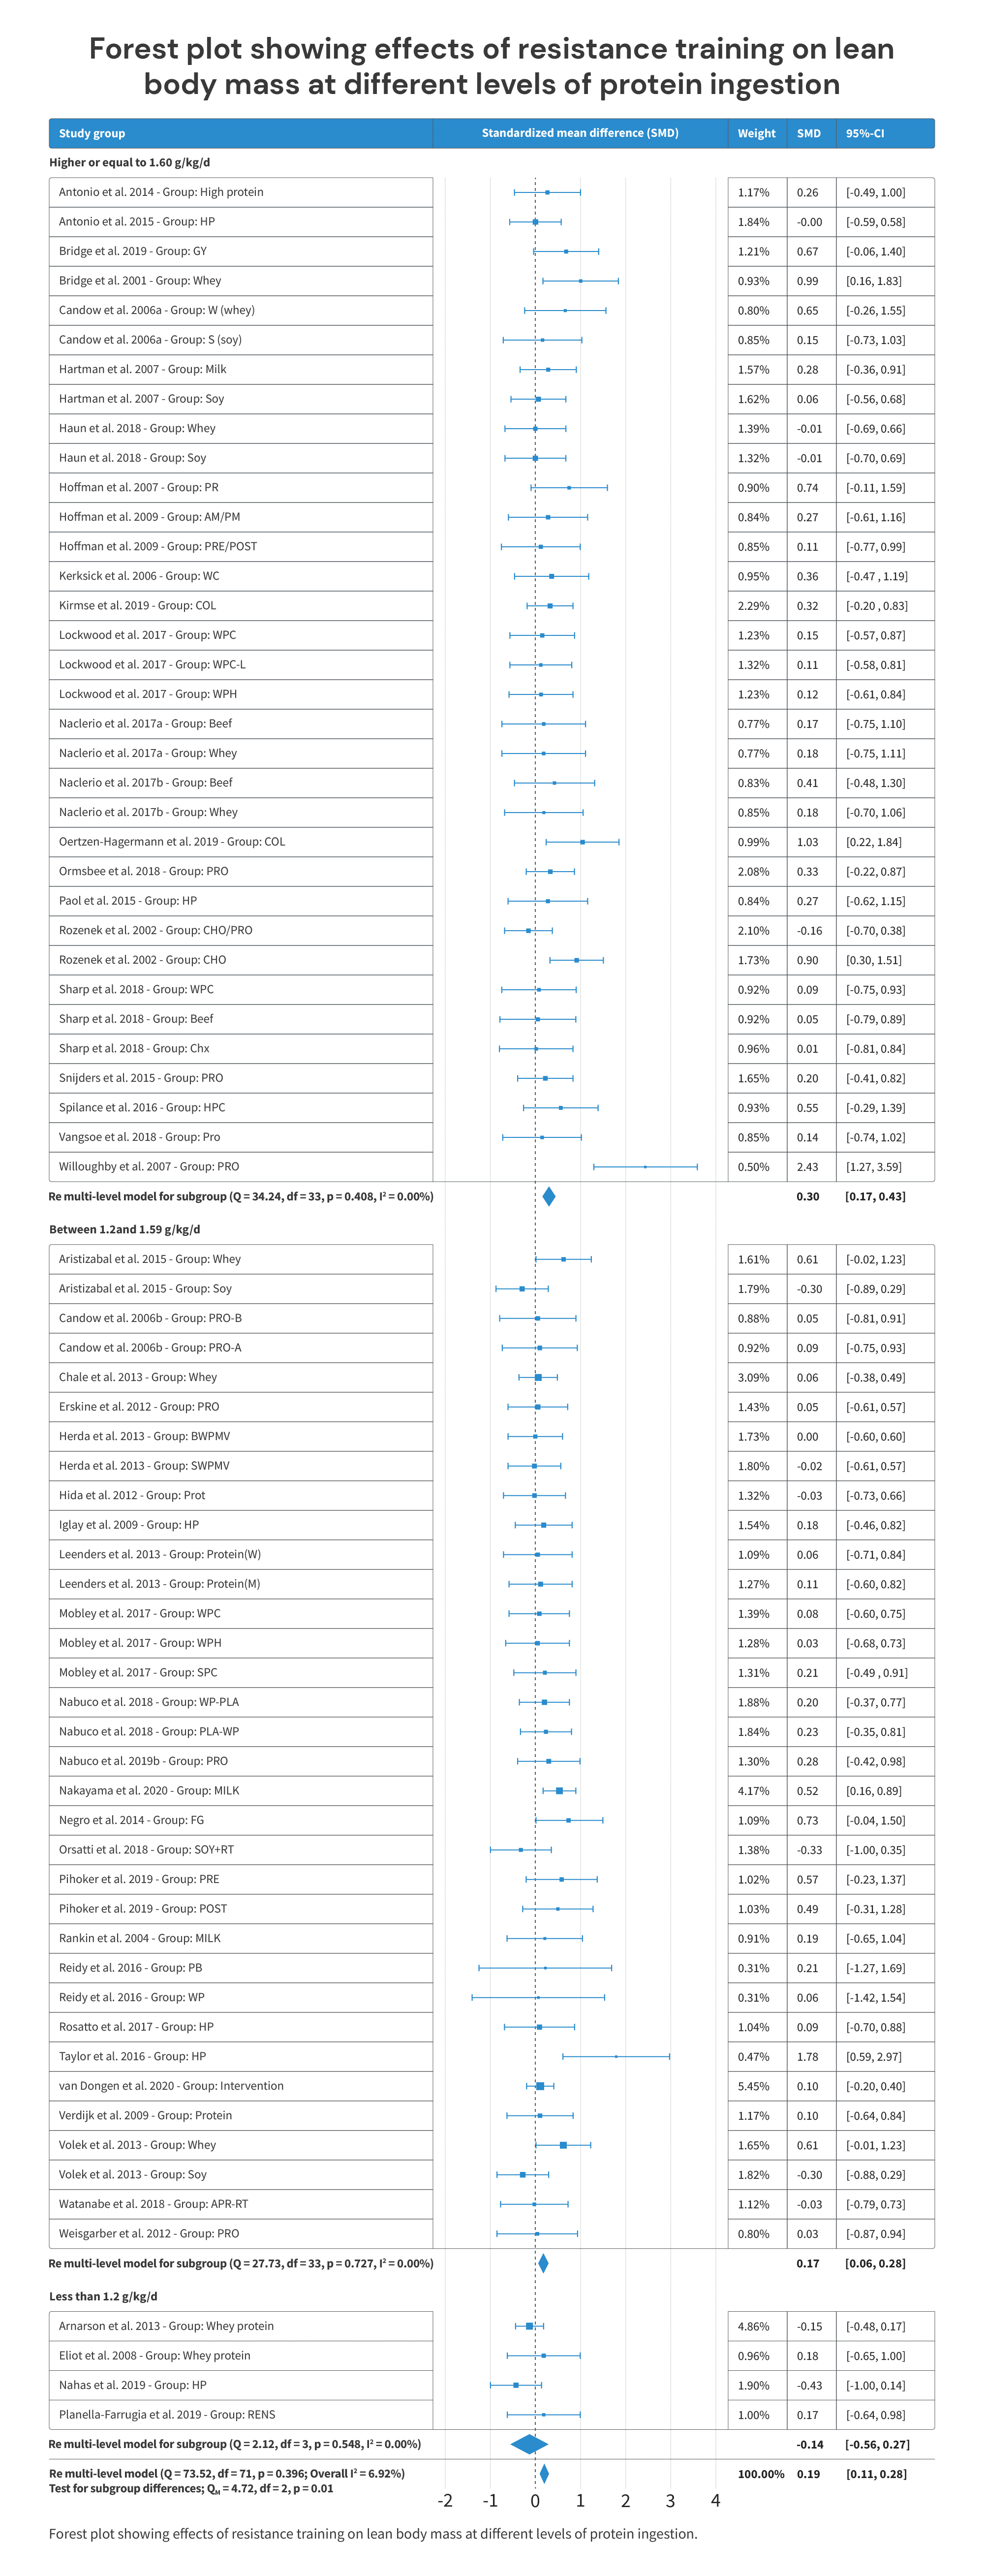
It reported its results in two ways. First, it reported the effects of consuming <1.2 grams of protein per kilogram of body weight (g = -0.14; p = 0.35), 1.2-1.59g/kg (g = 0.17; p <0.01), and ≥1.6g/kg (g = 0.30; p < 0.01).

Second, it reported a continuous analysis (similar to the breakpoint analysis in the Morton paper, and similar to the spline models in the Tagawa paper). However, unlike the Morton paper (which set out to identify a specific breakpoint) or the Tagawa paper (which included a “knot,” or inflection point, in the spline model), the Nunes paper just presents the results as a linear relationship:
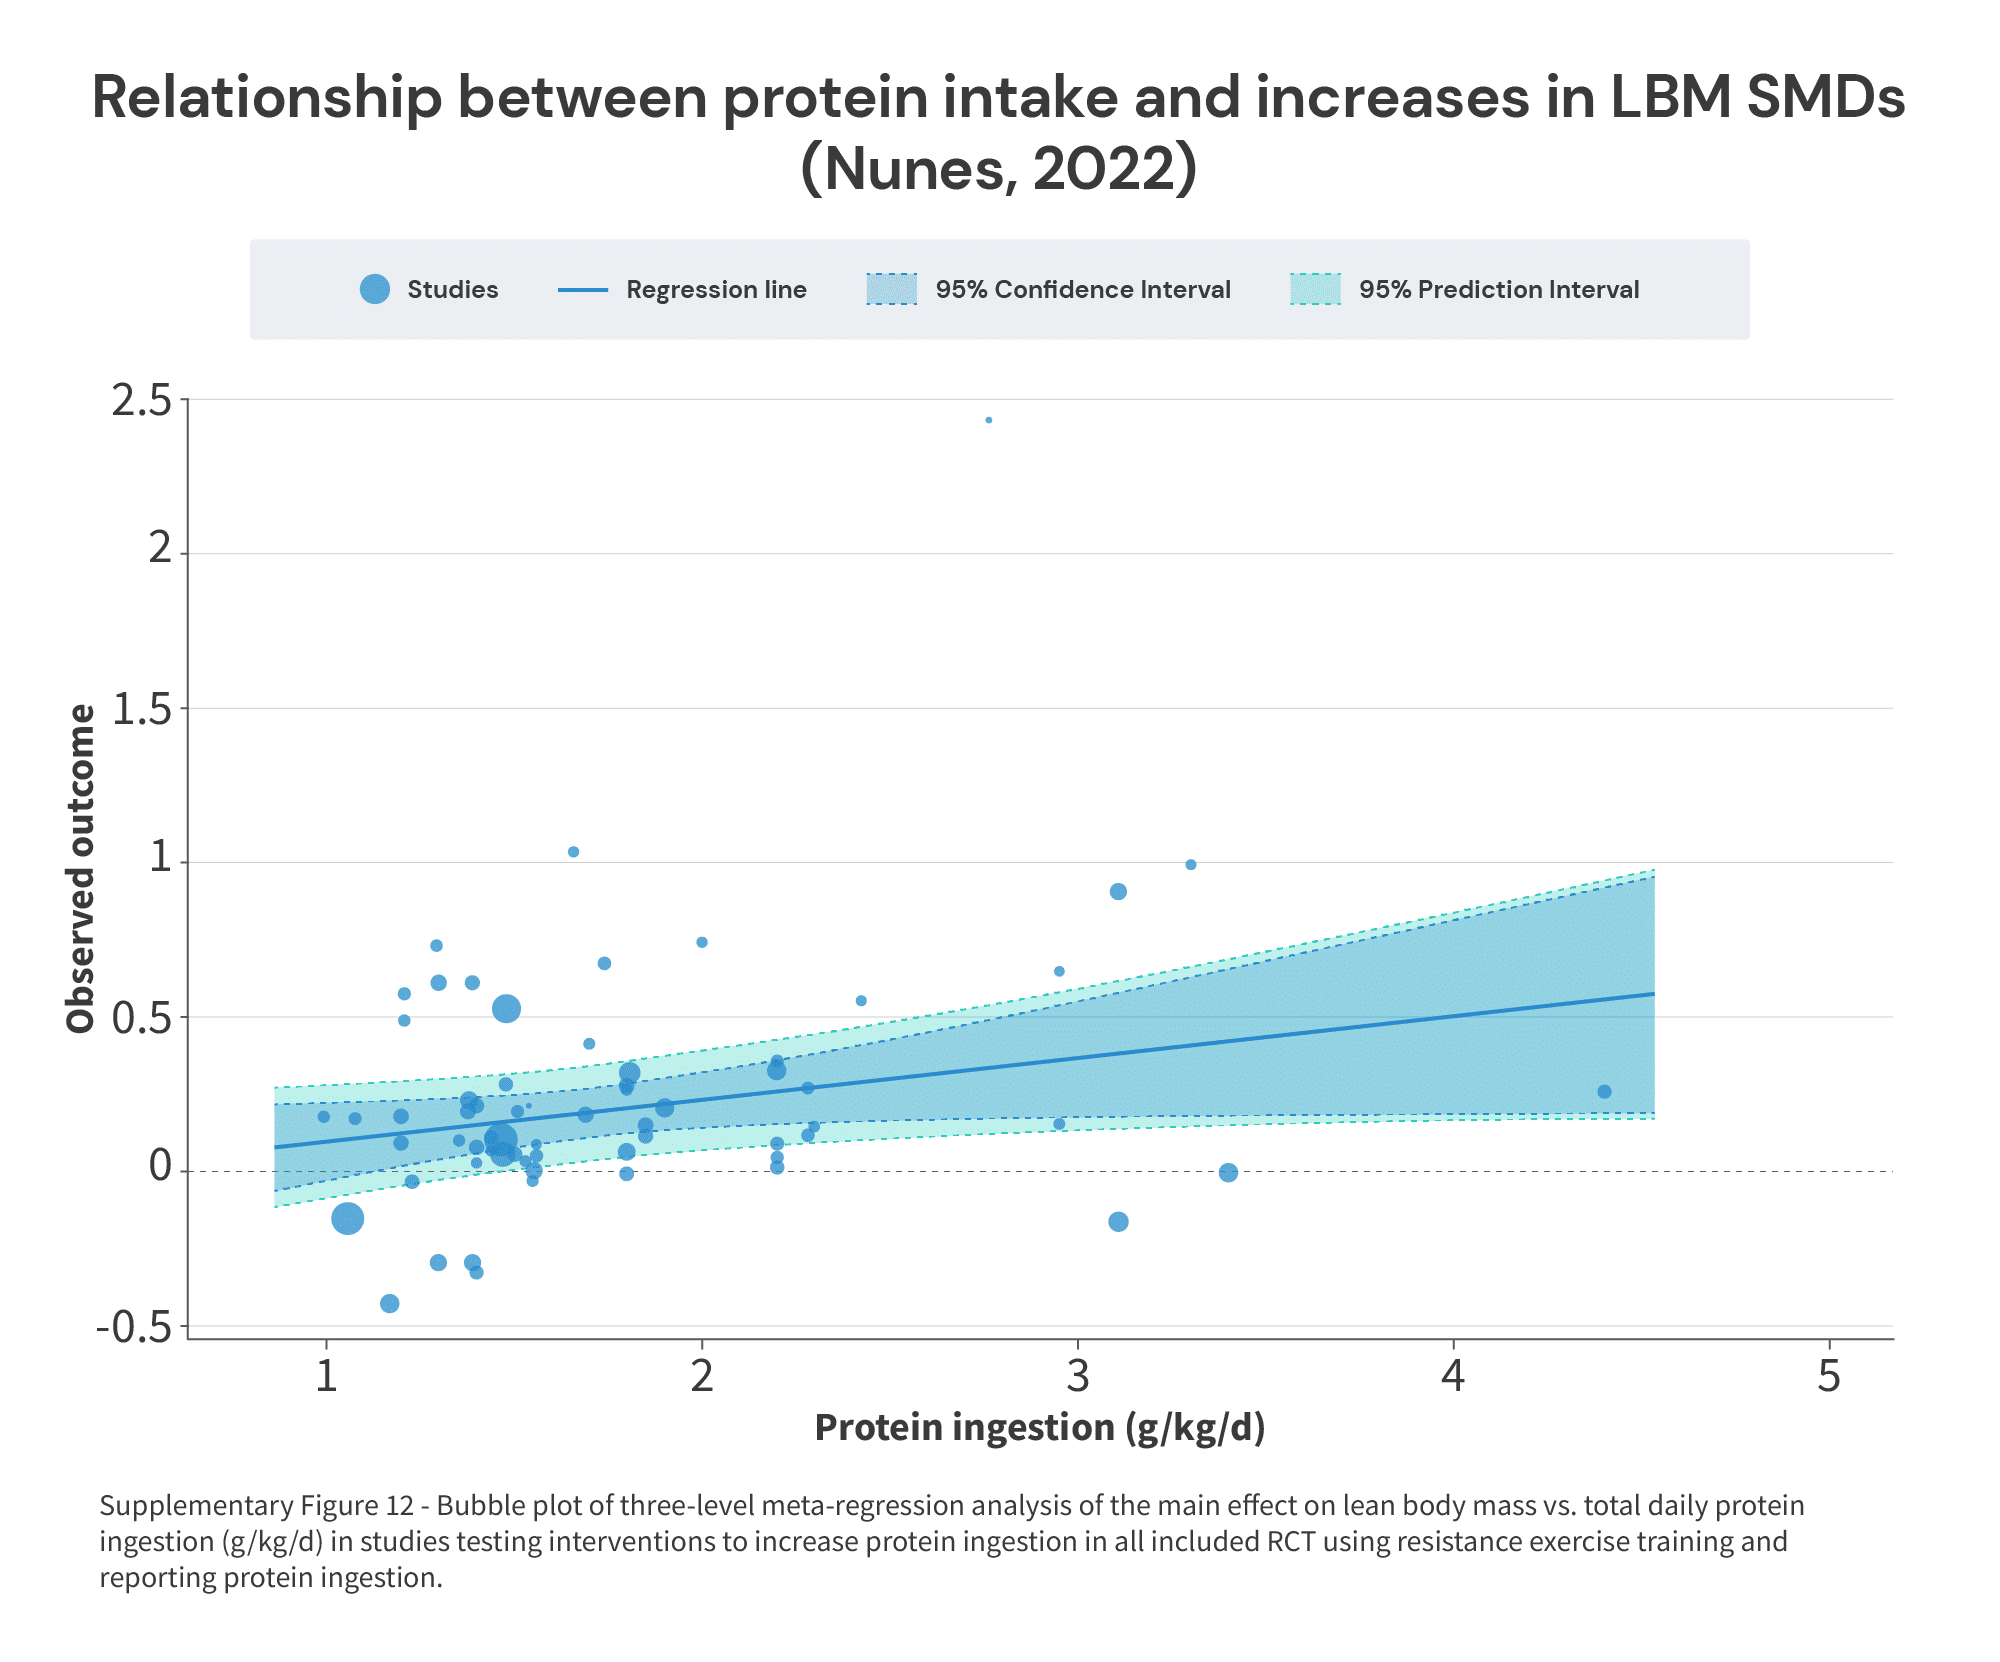

Now, if the effect of increased protein intake eventually reaches the point of diminishing (or zero) returns, a linear analysis isn’t going to be able to identify where that point lies. However, thankfully, Nunes and colleagues did a stellar job of sharing a supplementary table with the characteristics of all of the included studies (Table S1), which we can cross-reference against the effect sizes in Figure 2.
This let me build a table with the following information:
- The protein intake of the low-protein group(s) in each study
- The protein intake of the high-protein group(s) in each study
- The effect size for the comparison between protein intake levels
From there, I pooled protein intakes and effect sizes within each study to avoid double-counting. For example, in a study by Hartman and colleagues, there was one low-protein group consuming 1.56g of protein per kilogram of body mass, and two high-protein groups – one consumed 1.8g/kg, and one consumed 1.65g/kg. Furthermore, the effect size for one of the high-protein groups (describing the extent to which higher protein intake coincided with larger gains in FFM when comparing the low-protein group to one of the high-protein groups) was 0.28, and the effect size for the other high-protein group was 0.06. So, instead of extracting two comparisons from this study (which would, in effect, count the single low-protein group twice, since it was the point of comparison for both high-protein groups), it was collapsed down to one comparison: the low protein group consumed 1.56g/kg, and high protein groups consumed, on average, 1.725g/kg, and the average effect size was g = 0.17.
With this information, we can construct a figure similar to Supplementary Figure 3 from the Morton paper, in an attempt to identify the point at which further increases in protein intake don’t reliably lead to further increases in FFM or LBM:
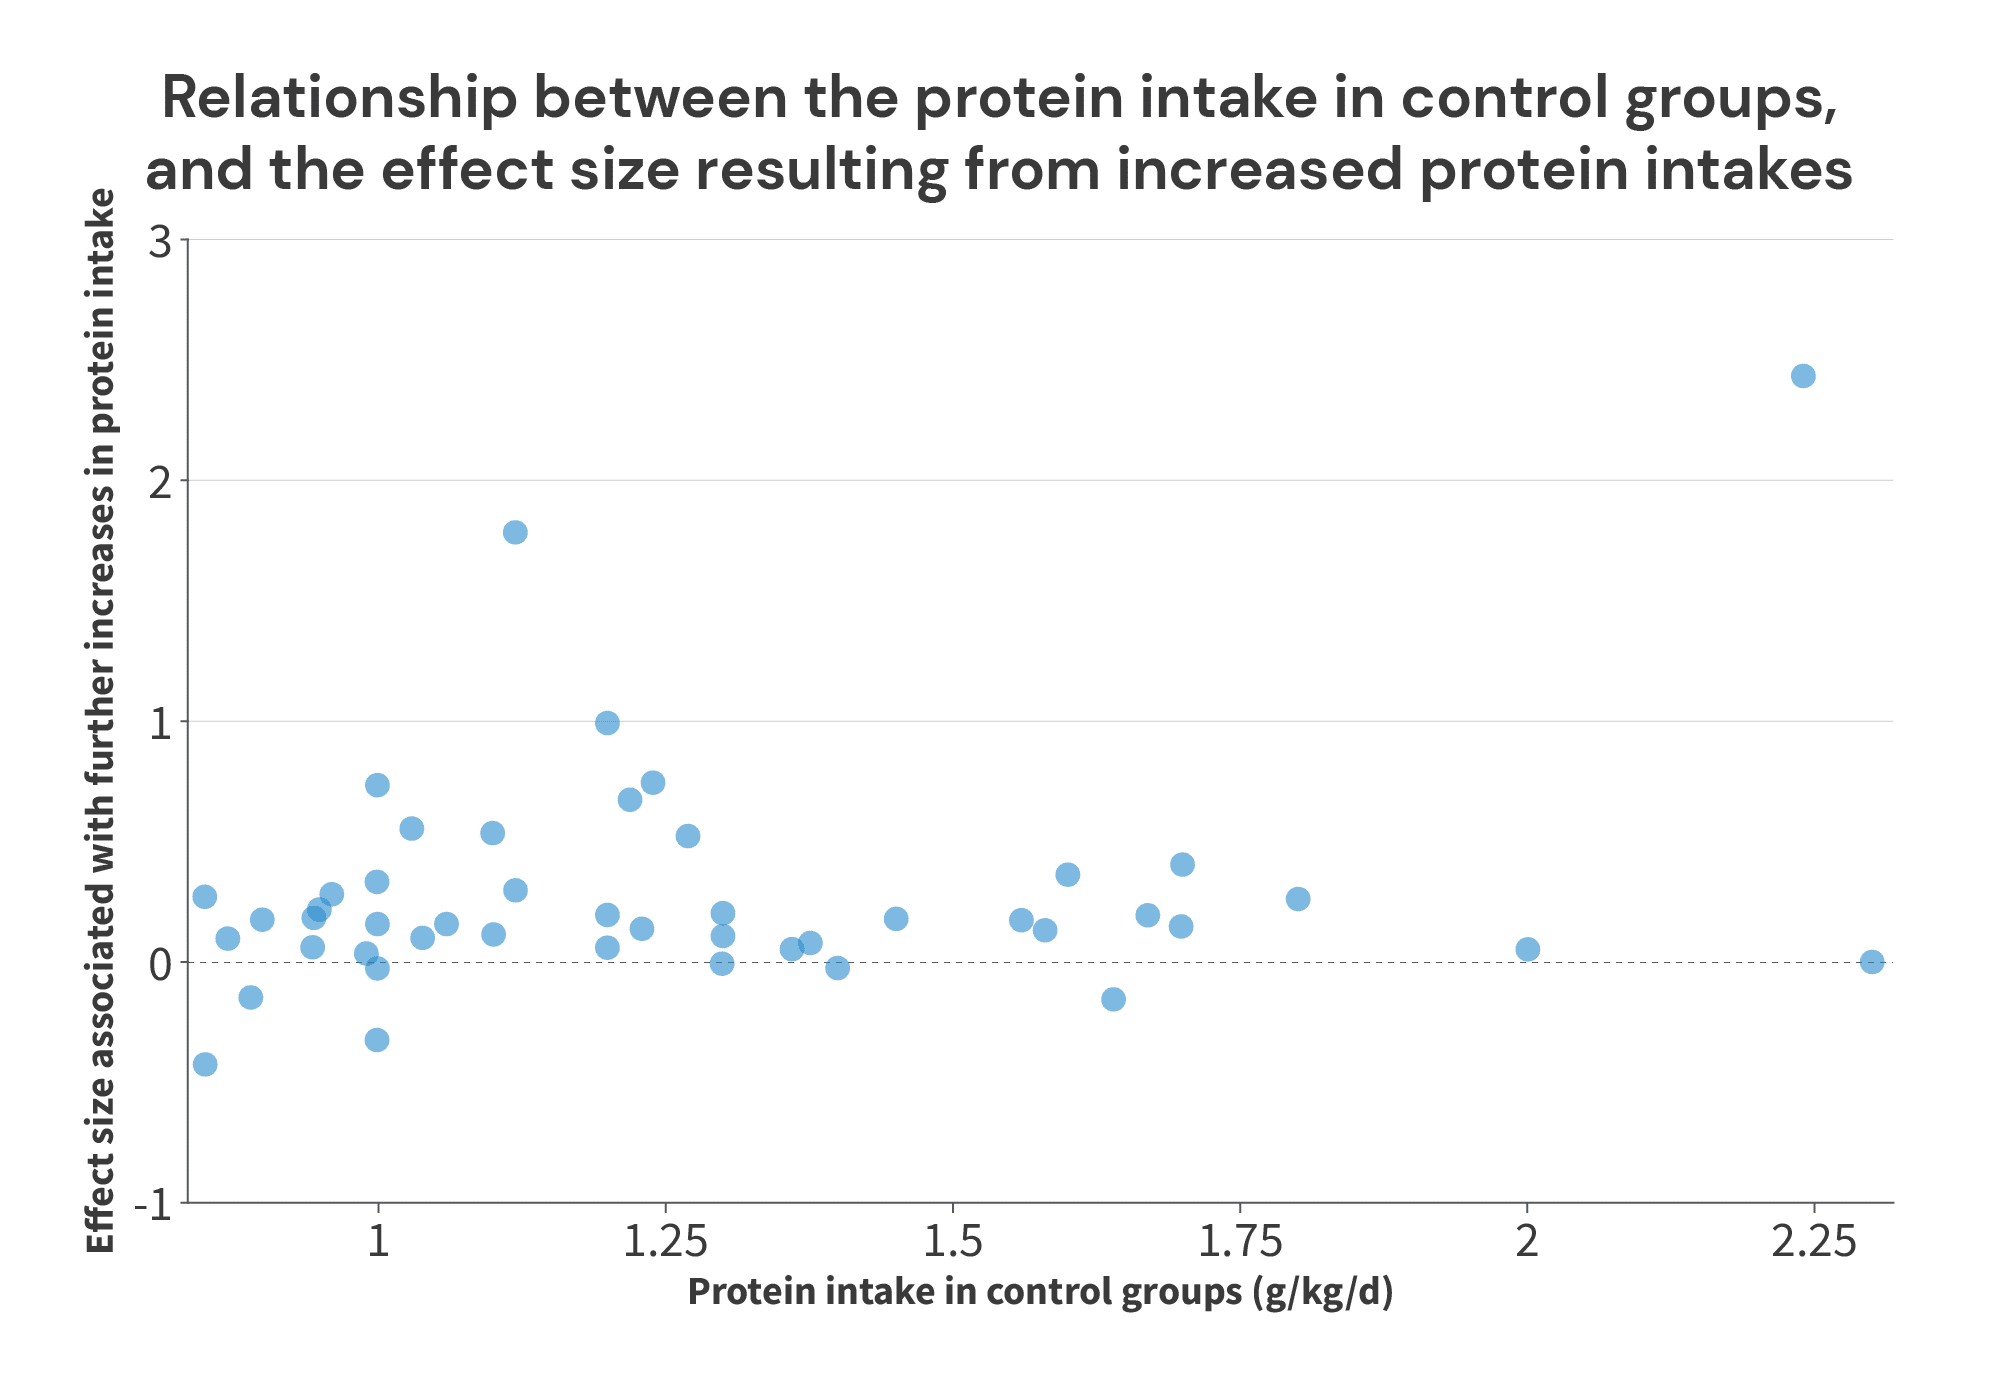

Just eyeballing this figure, two things jump off the screen at me. First, in most of the studies where the control groups consume an amount of protein that’s within the ballpark of the “breakpoint” from the Morton meta-regression (the cluster of 8 studies with control groups consuming between 1.55-1.8g/kg), further increases in protein intake led to further increases in FFM/LBM. Once again, this suggests that a 1.62g/kg “breakpoint” is likely too low. Second, the huge effect near the far right of the chart really sticks out.
That effect comes from a 2007 study by Willoughby and colleagues. This was a 10-week training study, where subjects consumed either 40g of protein (28 grams of whole proteins + 12g of free amino acids) or 40g of dextrose each day. Subjects in the placebo (dextrose) group averaged a protein intake of 2.06g/kg/day at the start of the study, and 2.24g/kg/day at the end of the study. Subjects in the intervention group averaged similar protein intakes throughout the day (2.15g/kg/day at the start of the study, and 2.31g/kg/day at the end) in addition to their daily protein supplement. Counting the supplement, their protein intake reached 2.76g/kg/day at the end of the study.
This additional protein appears to have paid off. The placebo group gained 2.7kg of fat-free mass over the course of the study, and the group receiving the protein supplement gained 5.62kg of fat-free mass. Really impressive stuff!
However, this study is a pretty large outlier. It first caught my eye in a 2020 meta-analysis by Benito and colleagues, which simply aimed to quantify the typical gains in LBM or FFM that are observed in response to resistance training (it’s about 1.5kg in about 10 weeks, for anyone wondering). Out of the 111 studies and 158 discrete groups included in this meta-analysis, basically all of the results clustered between 0-3kg of LBM or FFM, with two exceptions: this study by Willoughby (+5.62kg of FFM), and an exogenous growth hormone study by Deyssig and colleagues (+7.20kg of LBM). No other study reported increases that even reached 4.0kg (the next highest was 3.9kg). So, this is certainly a noteworthy finding, but I’m going to exclude it from here on out.
To go one step further, we need to consider not just the protein intake of the low-protein groups in these studies, but also the difference in protein intake between the low- and high-protein groups.
For example, there might be two studies where the placebo group consumed 1.5g/kg of protein, but in study A, the high-protein group consumes 2.5g/kg of protein, and in study B, the high-protein group consumes just 1.6g/kg of protein. In the chart above, both of these studies would have the same x-coordinate, but it shouldn’t be too surprising if higher protein intakes are associated with larger increases in FFM in study A, but not in study B. However, if all we plot is the protein intake in the placebo group, we might wonder why it looks like increases in protein intake above 1.5g/kg lead to large gains in FFM in some studies but not others. To correct for this issue, a simple average can do the trick, since it incorporates information about the protein intakes of both the low-protein group and the high-protein group.
To further account for the differences in protein intake between groups, we can calculate effect size slopes. In the example above, we shouldn’t be surprised if increasing protein by 0.1g/kg has a very small impact on FFM, and that increasing protein by 1g/kg has a much larger impact on FFM. But, if we divide the effect size by the difference in protein intake (in g/kg), we can get a standardized unit: effect size gains per 1g/kg of additional protein.
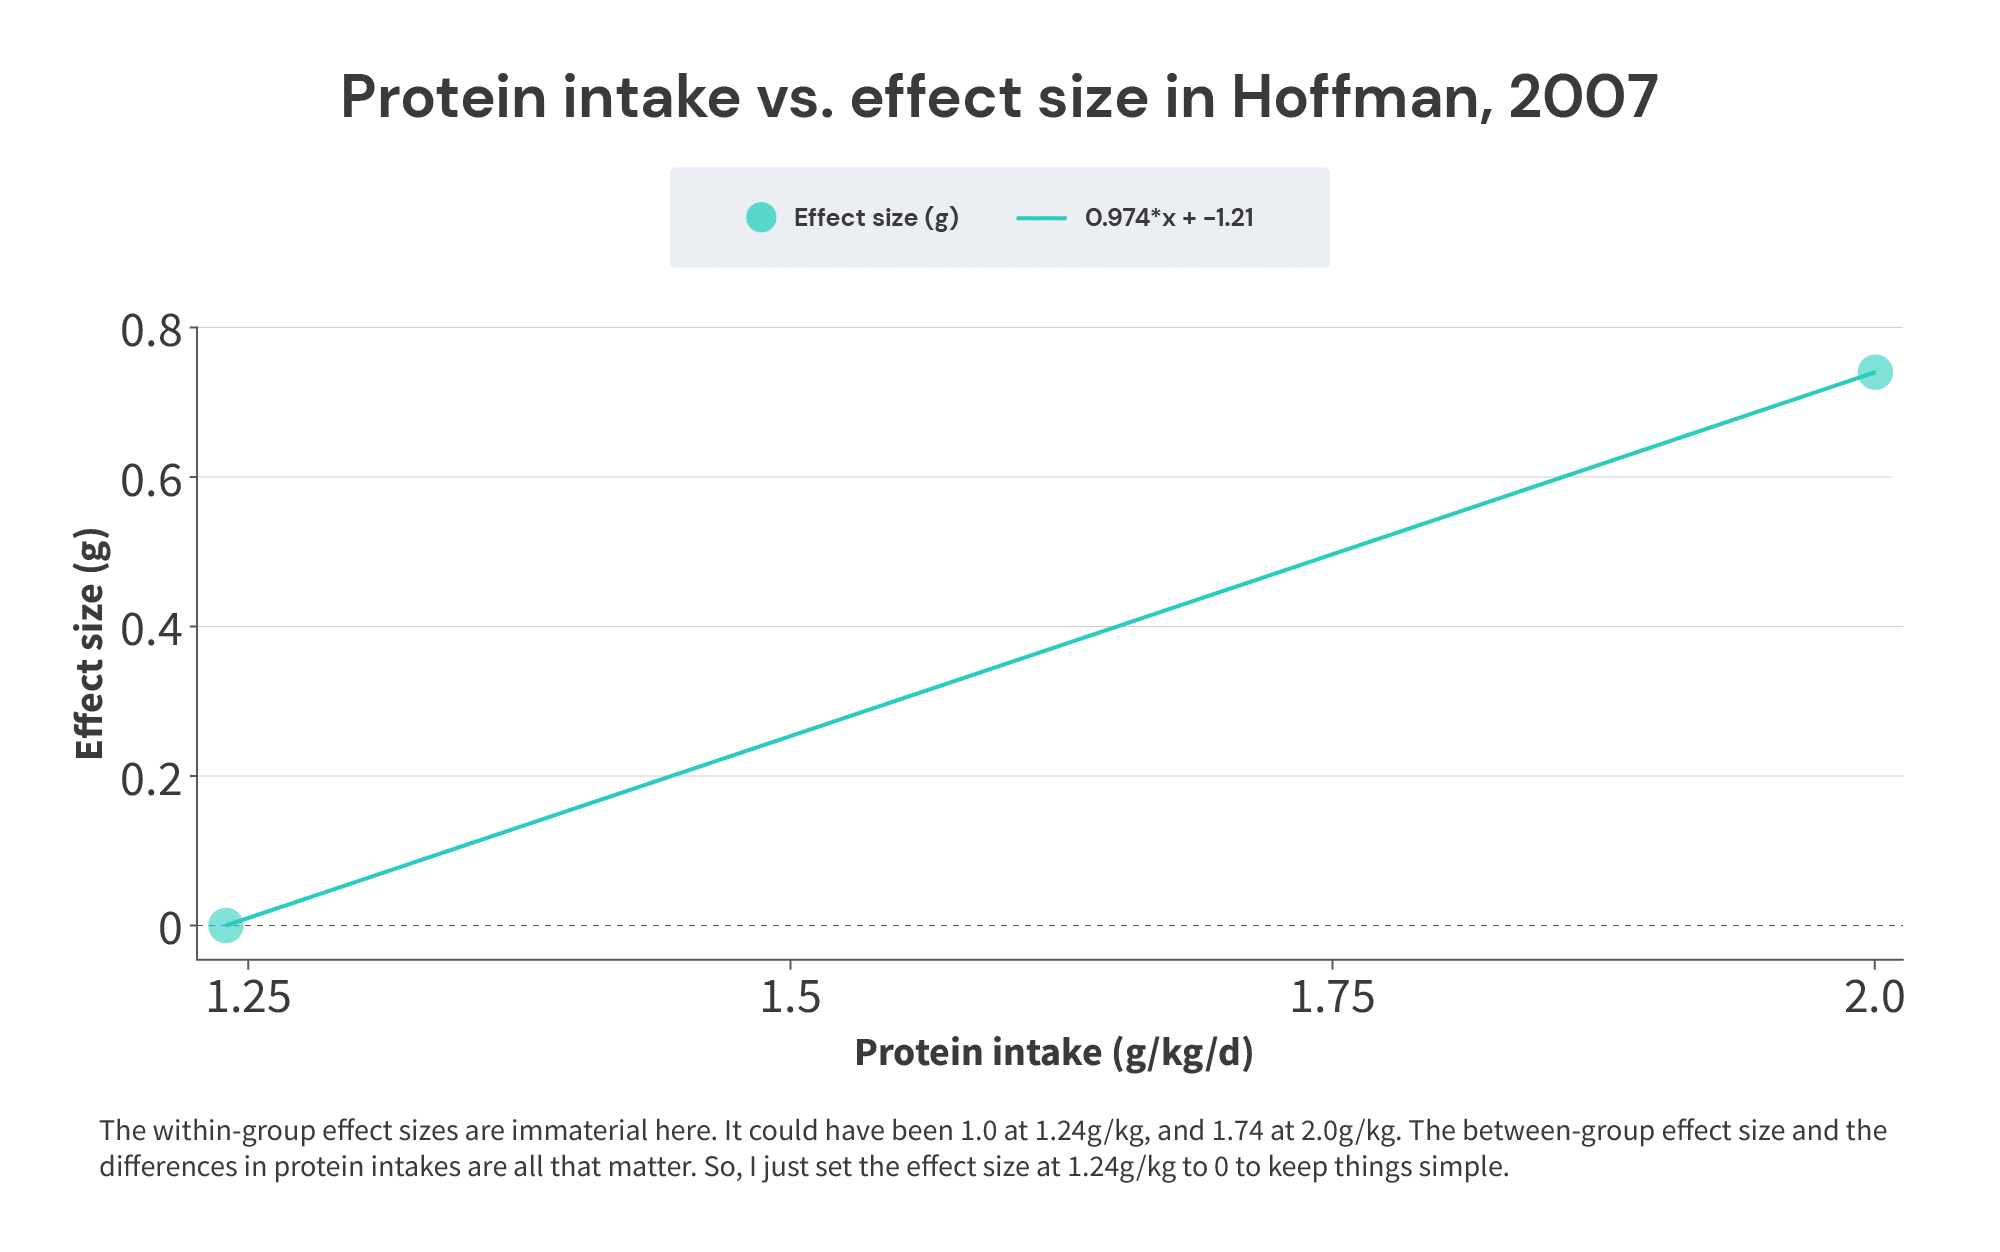
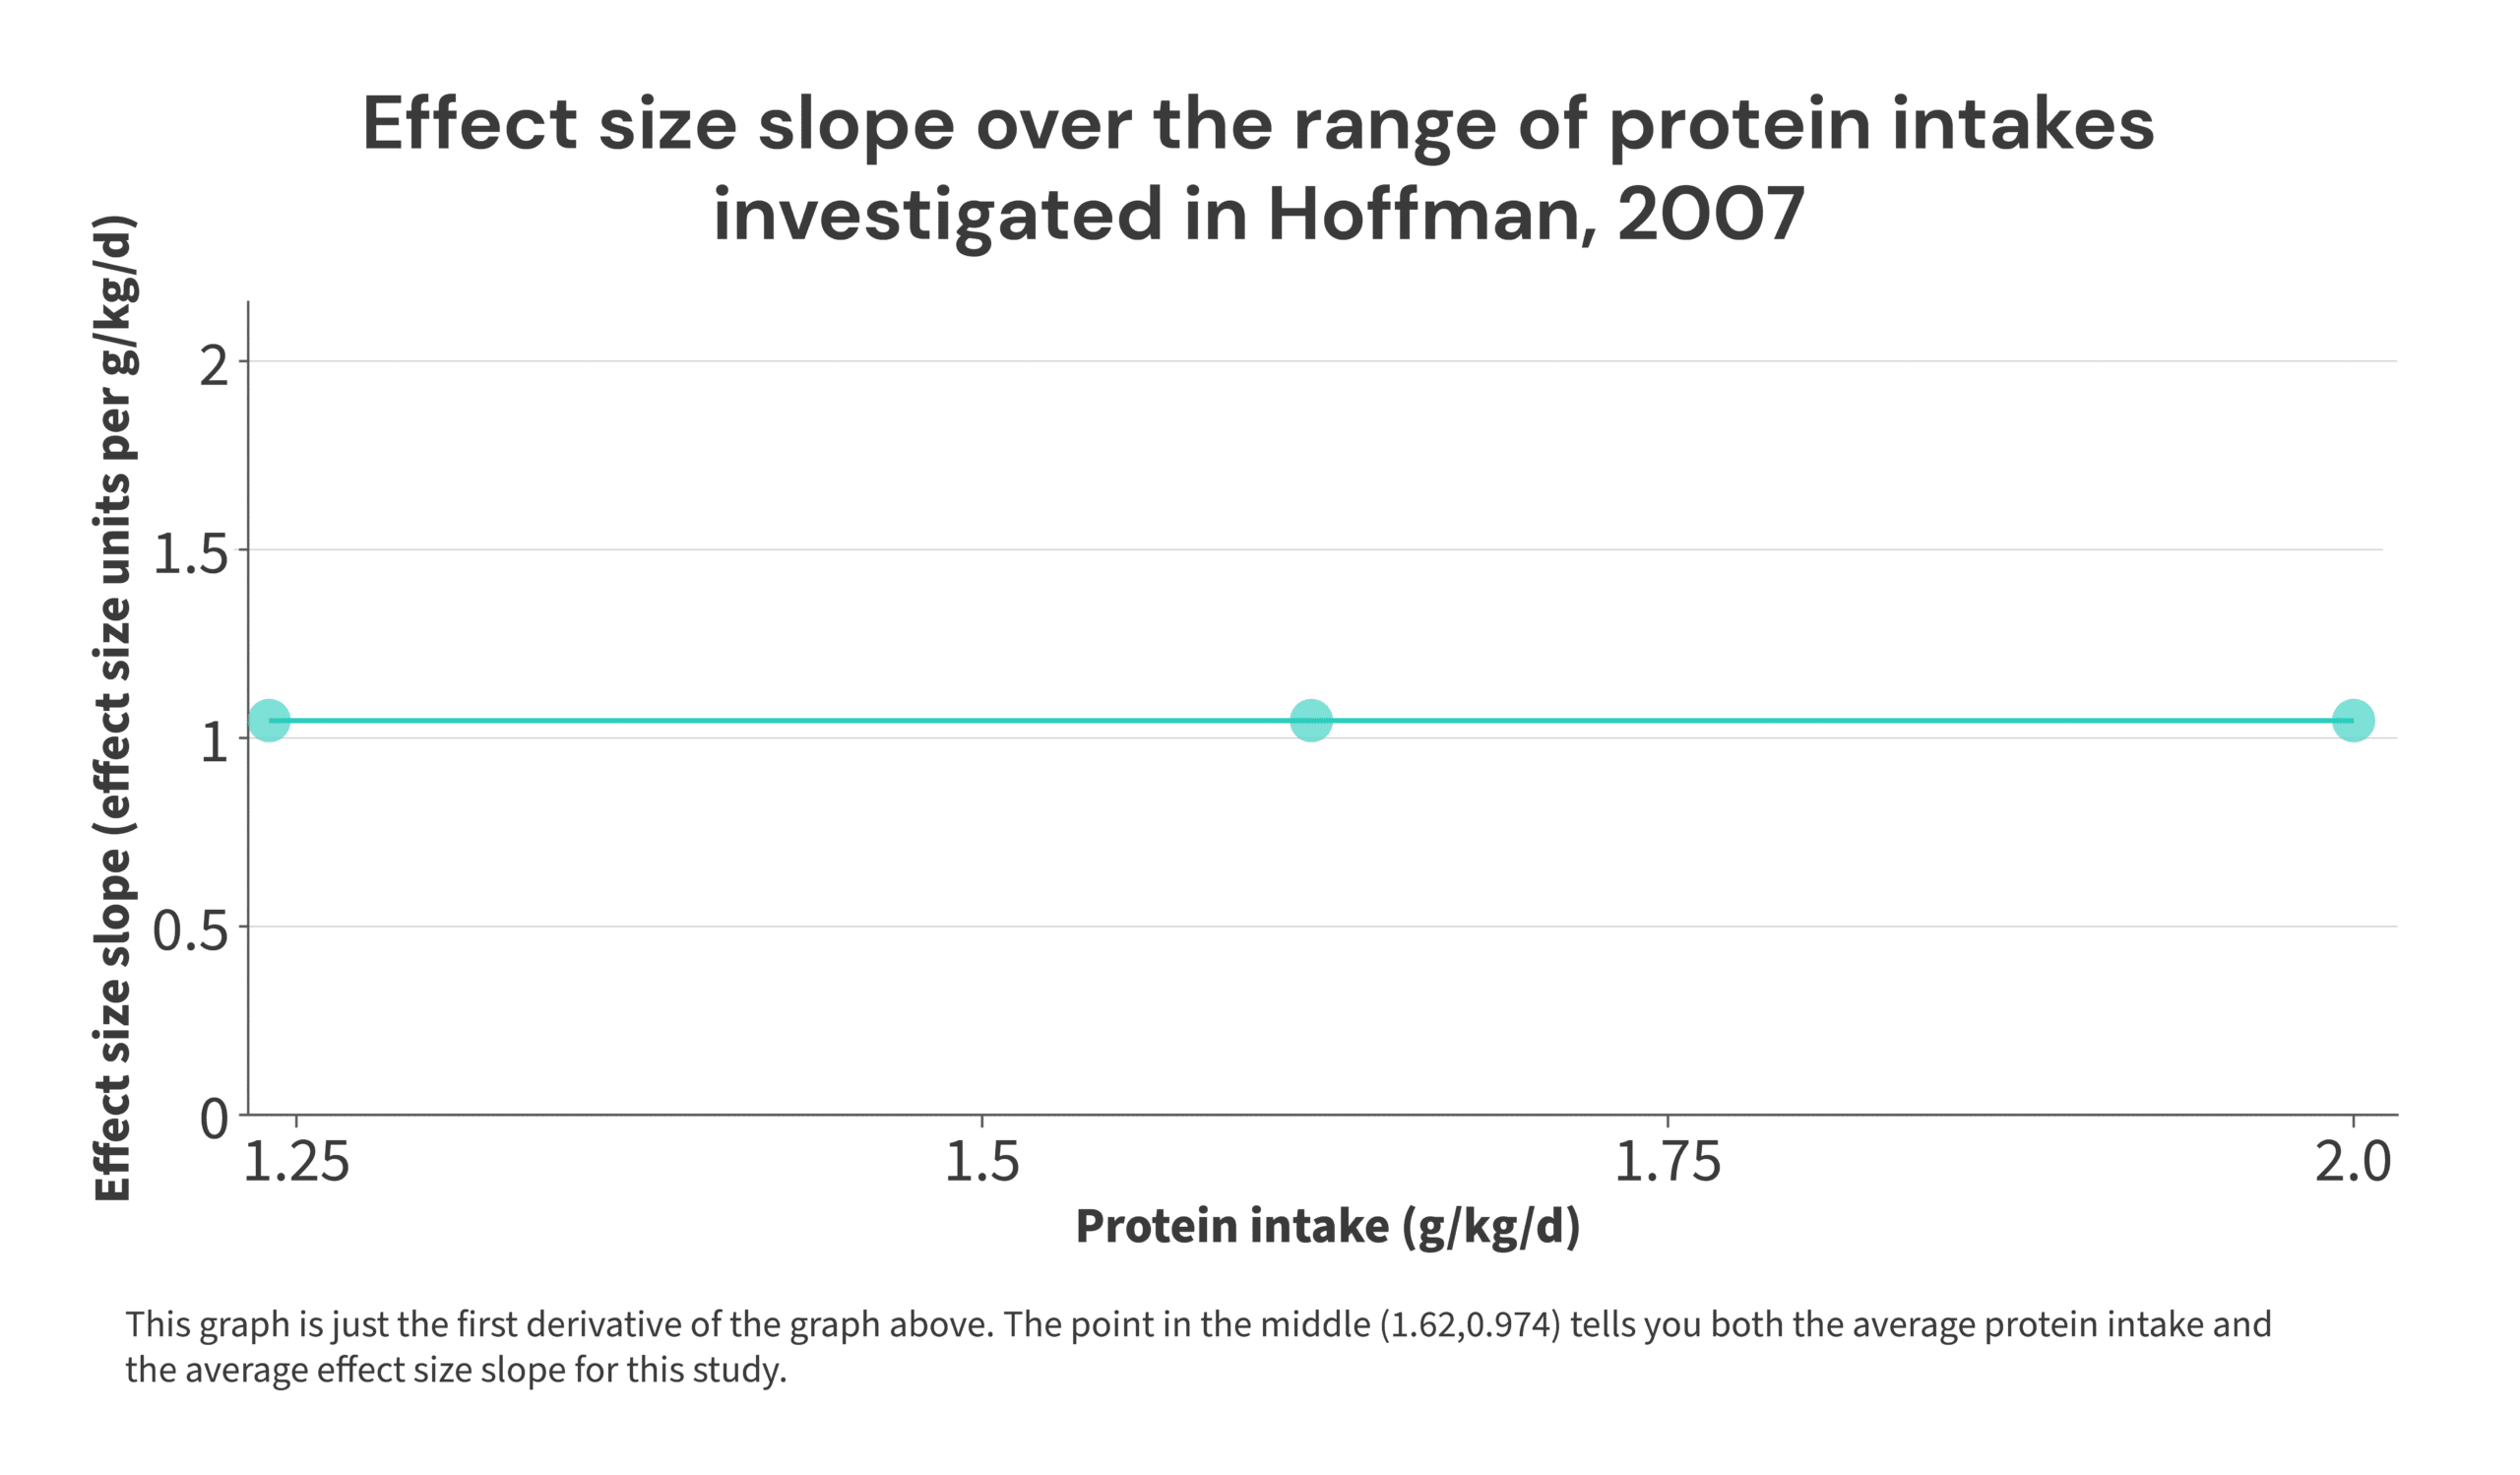
Here’s a simple illustration: in the 2007 Hoffman study referenced previously, the low-protein group consumed 1.24g/kg, and the high-protein group consumed 2.0g/kg. The effect size was 0.74. So, a 0.76g/kg increase in protein intake resulted in an effect size of 0.74. Thus, the effect size increased by: 0.74/0.76 = 0.974 effect size units per 1g/kg increase in protein intake, averaged over the range of 1.24-2g/kg of protein intake. The midpoint of the range is 1.62g/kg. So, the point (1.62,0.974) would tell you the midpoint of the range of protein intakes included in the study, and the rate at which the effect size increased throughout that range.


I realize this may seem fairly abstract, but it ties back to the discussion of Simpson’s Paradox from earlier. Just to save you a bit of scrolling, these were the theoretical studies used for that illustration:


In Study 1, we see that 1 set led to 4 more units of hypertrophy than 3 sets. So, over the range of 1-3 sets, increasing volume led to 2 additional units of hypertrophy per set (i.e., 2 units of hypertrophy per set would be the sets vs. hypertrophy slope), and this rate of increase is centered at the midpoint (2 sets) of the set range used. So, we’d plot the point (2,2) for Study 1. Similar story for Study 2 – each additional set led to 2 additional units of hypertrophy, but this time, the increase is centered at 3 sets per week. So, we’d graph the point (3,2) for Study 2. When we repeat this process for all 8 studies, we’d wind up with a graph that looks like this:
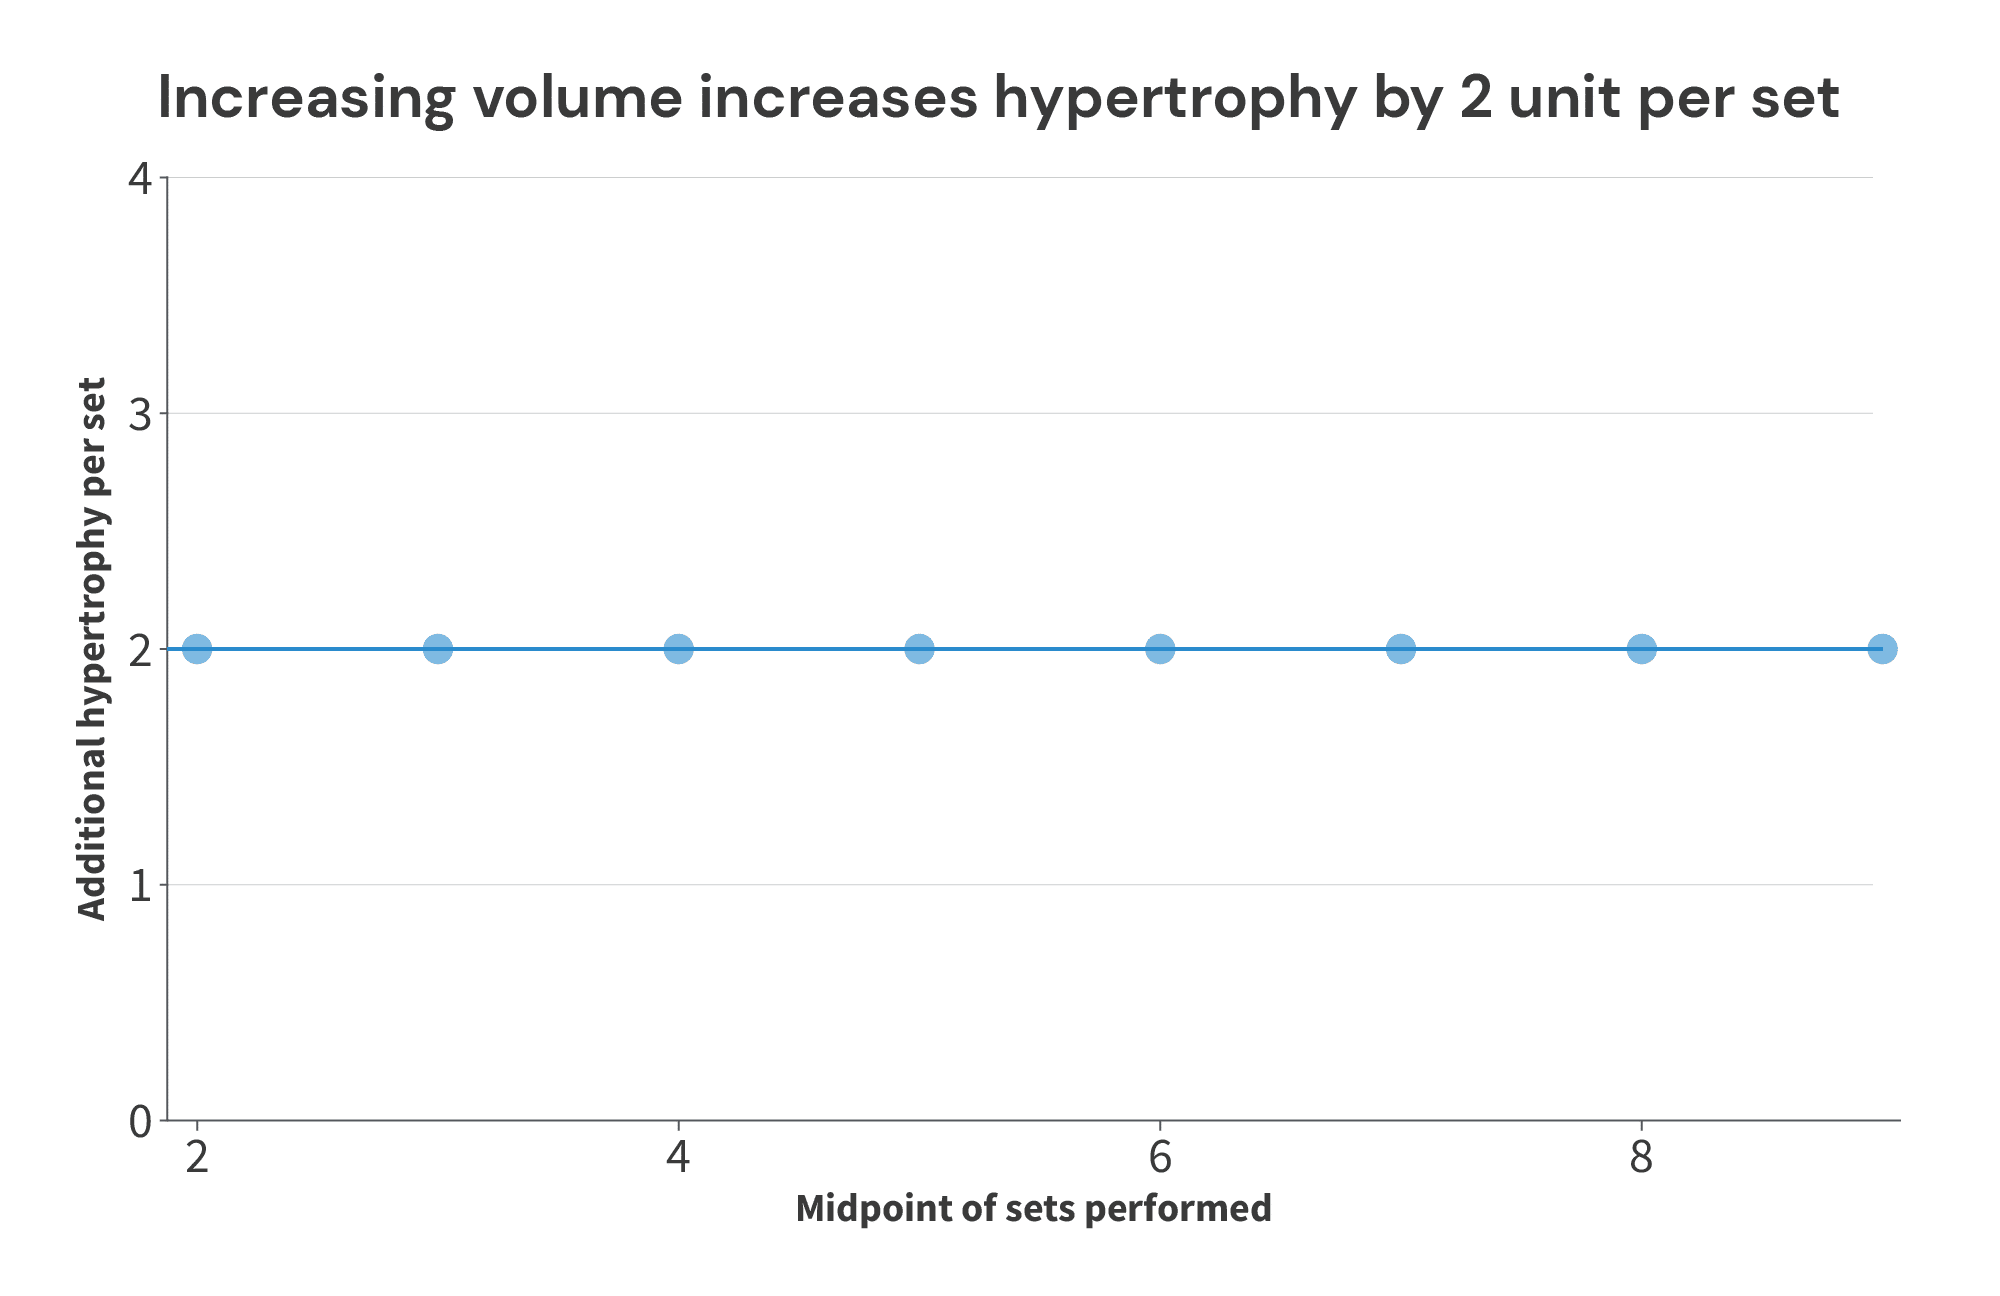

As you can see, this fairly and accurately describes the data. For all levels of volume studied, doing 2 more sets increased muscle growth by 4 units. So, over the range of volumes investigated in these theoretical studies, each additional set yields 2 additional units of hypertrophy.
But now, let’s assume that there actually is a breakpoint, where increasing volume fails to lead to further increases in muscle growth. As we’ll see, this method of plotting and analyzing slopes can actually do a better job of identifying the breakpoint than simply plotting volume performed vs. hypertrophy observed in each study arm (because again, focusing on within-study differences helps negate differences between studies and study populations that also influence the outcome of interest, independent of the impact of the intervention itself). To illustrate, I’ll use a new batch of theoretical studies:


If we just plot sets performed vs. hypertrophy observed in each study arm, we wind up with a graph that looks like this:
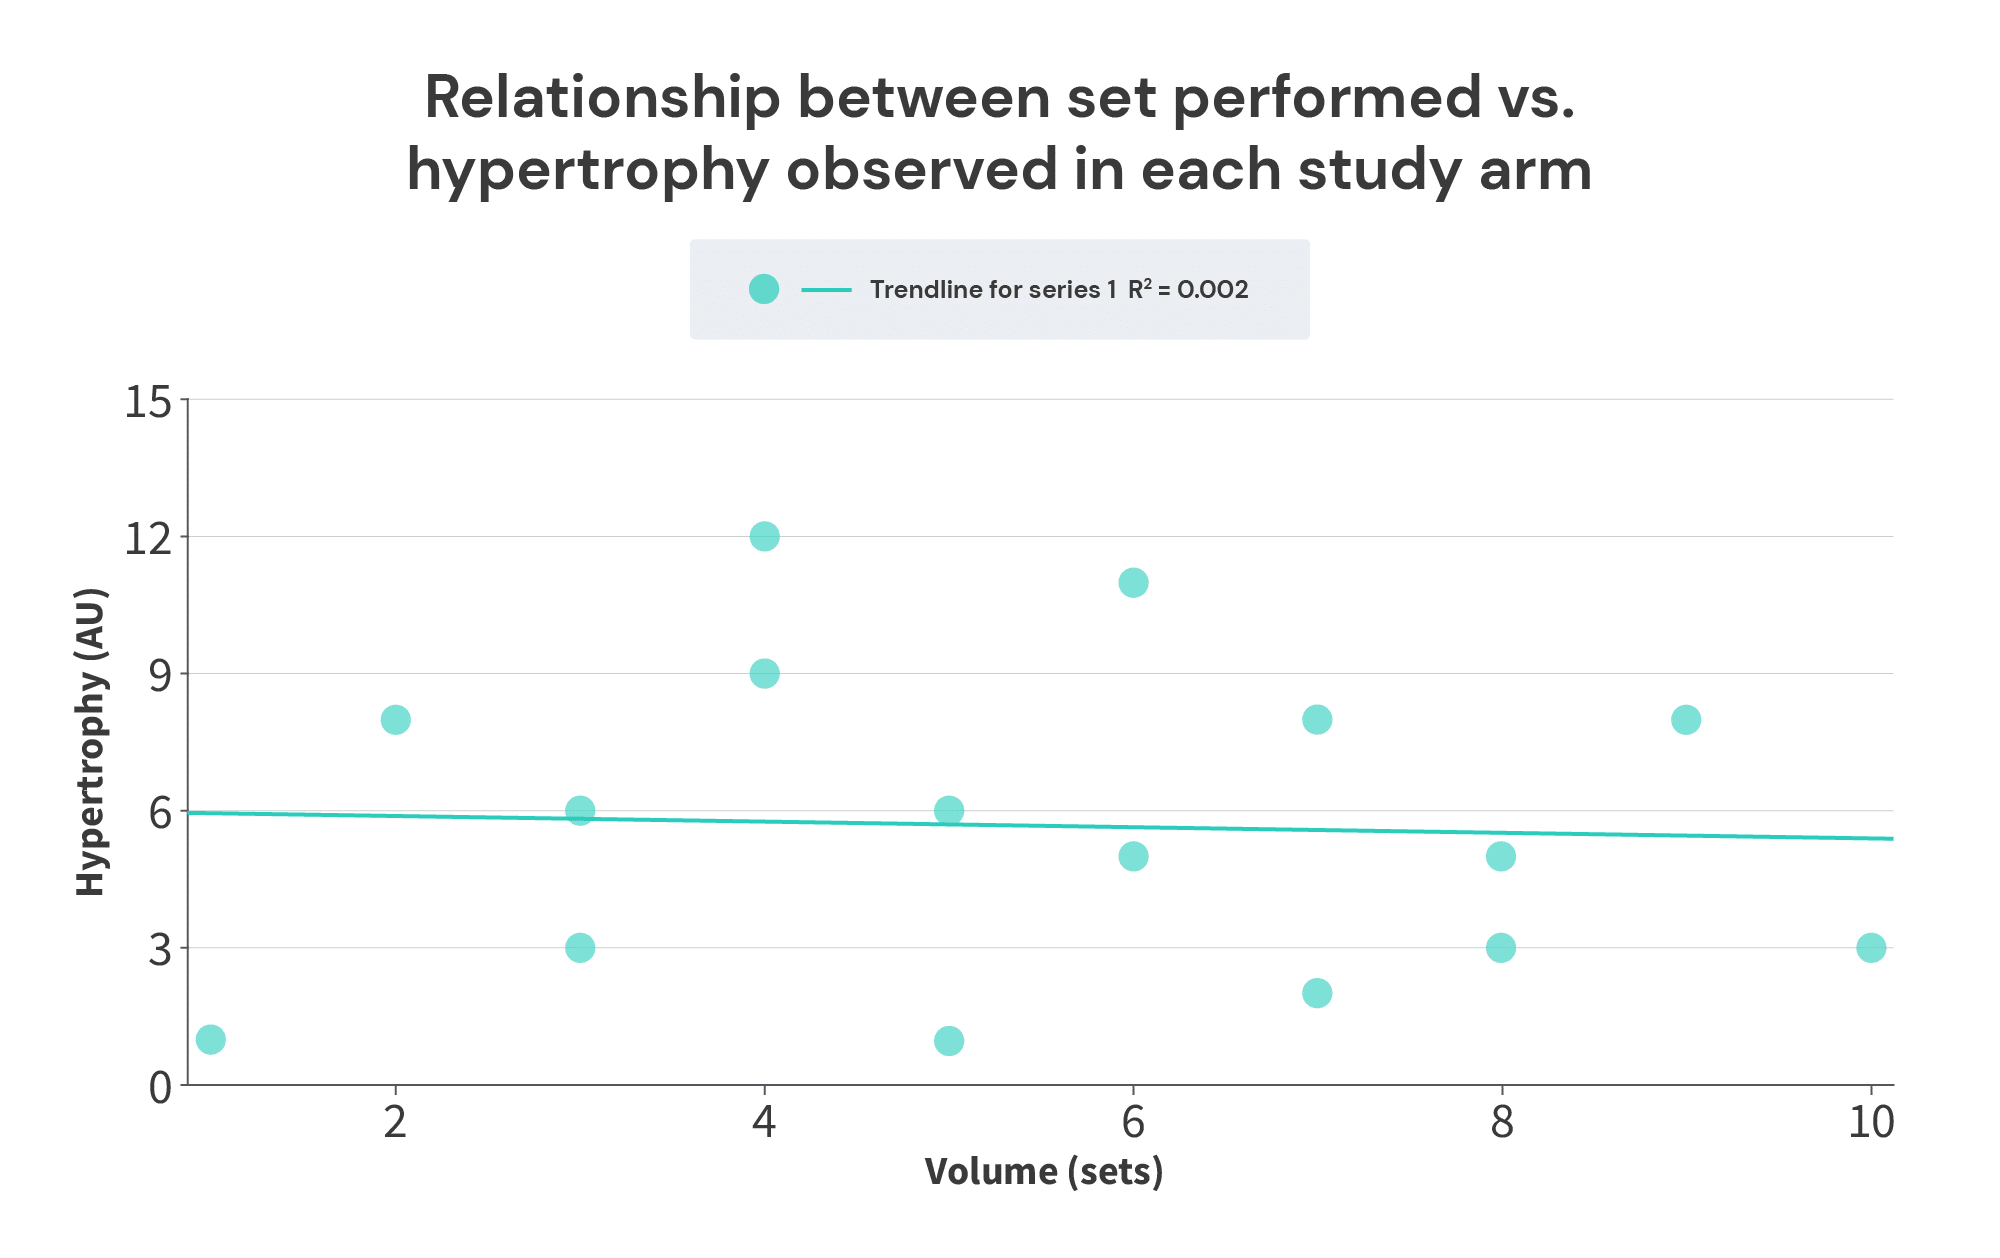

Not only does there not appear to be a breakpoint – there doesn’t appear to be any relationship at all! However, when we analyze the average set volume performed versus the volume/hypertrophy slope within each study, the breakpoint becomes clear: additional increases in volume past 7 sets fail to lead to more growth:


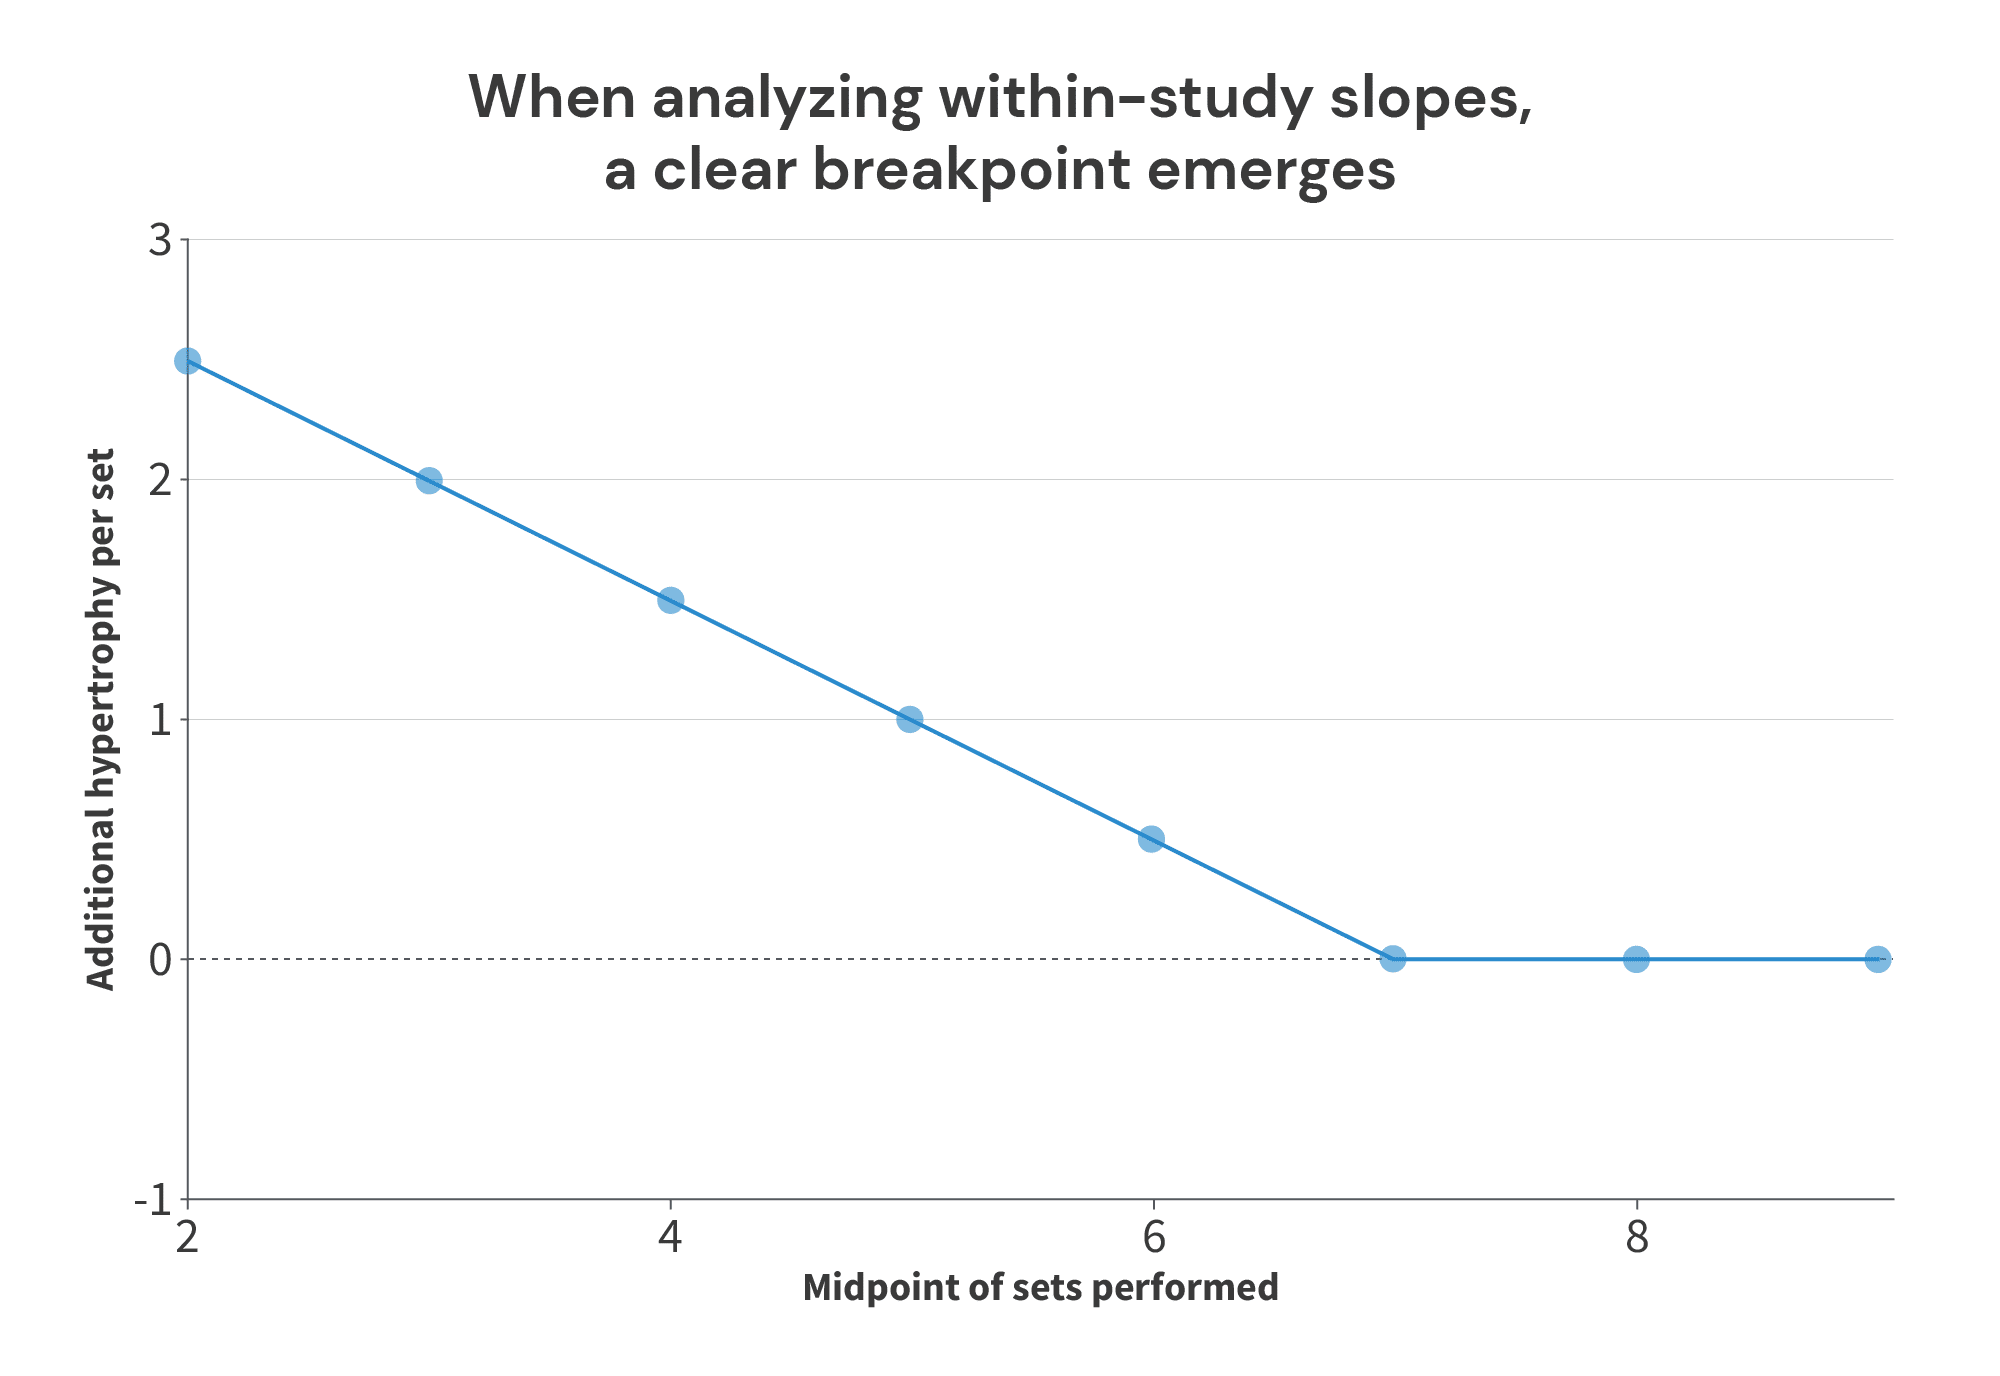

I realize that was quite a bit of windup and explanation, but I just wanted to make sure we’re all on the same page before moving ahead. This section is fairly technical, and I know that thinking in terms of derivatives of the outcome of interest (rather than just thinking in terms of the outcome of interest), or comparing within-study differences in the outcome of interest between studies (rather than just comparing the outcome of interest between studies) can feel a bit unintuitive. So, that’s why I spent a bit more time than normal on explaining and illustrating this concept. But, I think it’s an important concept to grasp, because I do truly think this is a better approach for determining the point past which additional protein intake fails to yield additional benefits.
So, with all of that out of the way, here’s the data from the 50 studies from the Nunes meta-analysis that were amenable for this analysis (the studies that were excluded were studies where a protein supplement was provided, but total protein intake wasn’t reported):


*As mentioned previously, the Willoughby study is a pretty large outlier, so it won’t be included in the graph below
Now, here’s how the data looks when graphed:
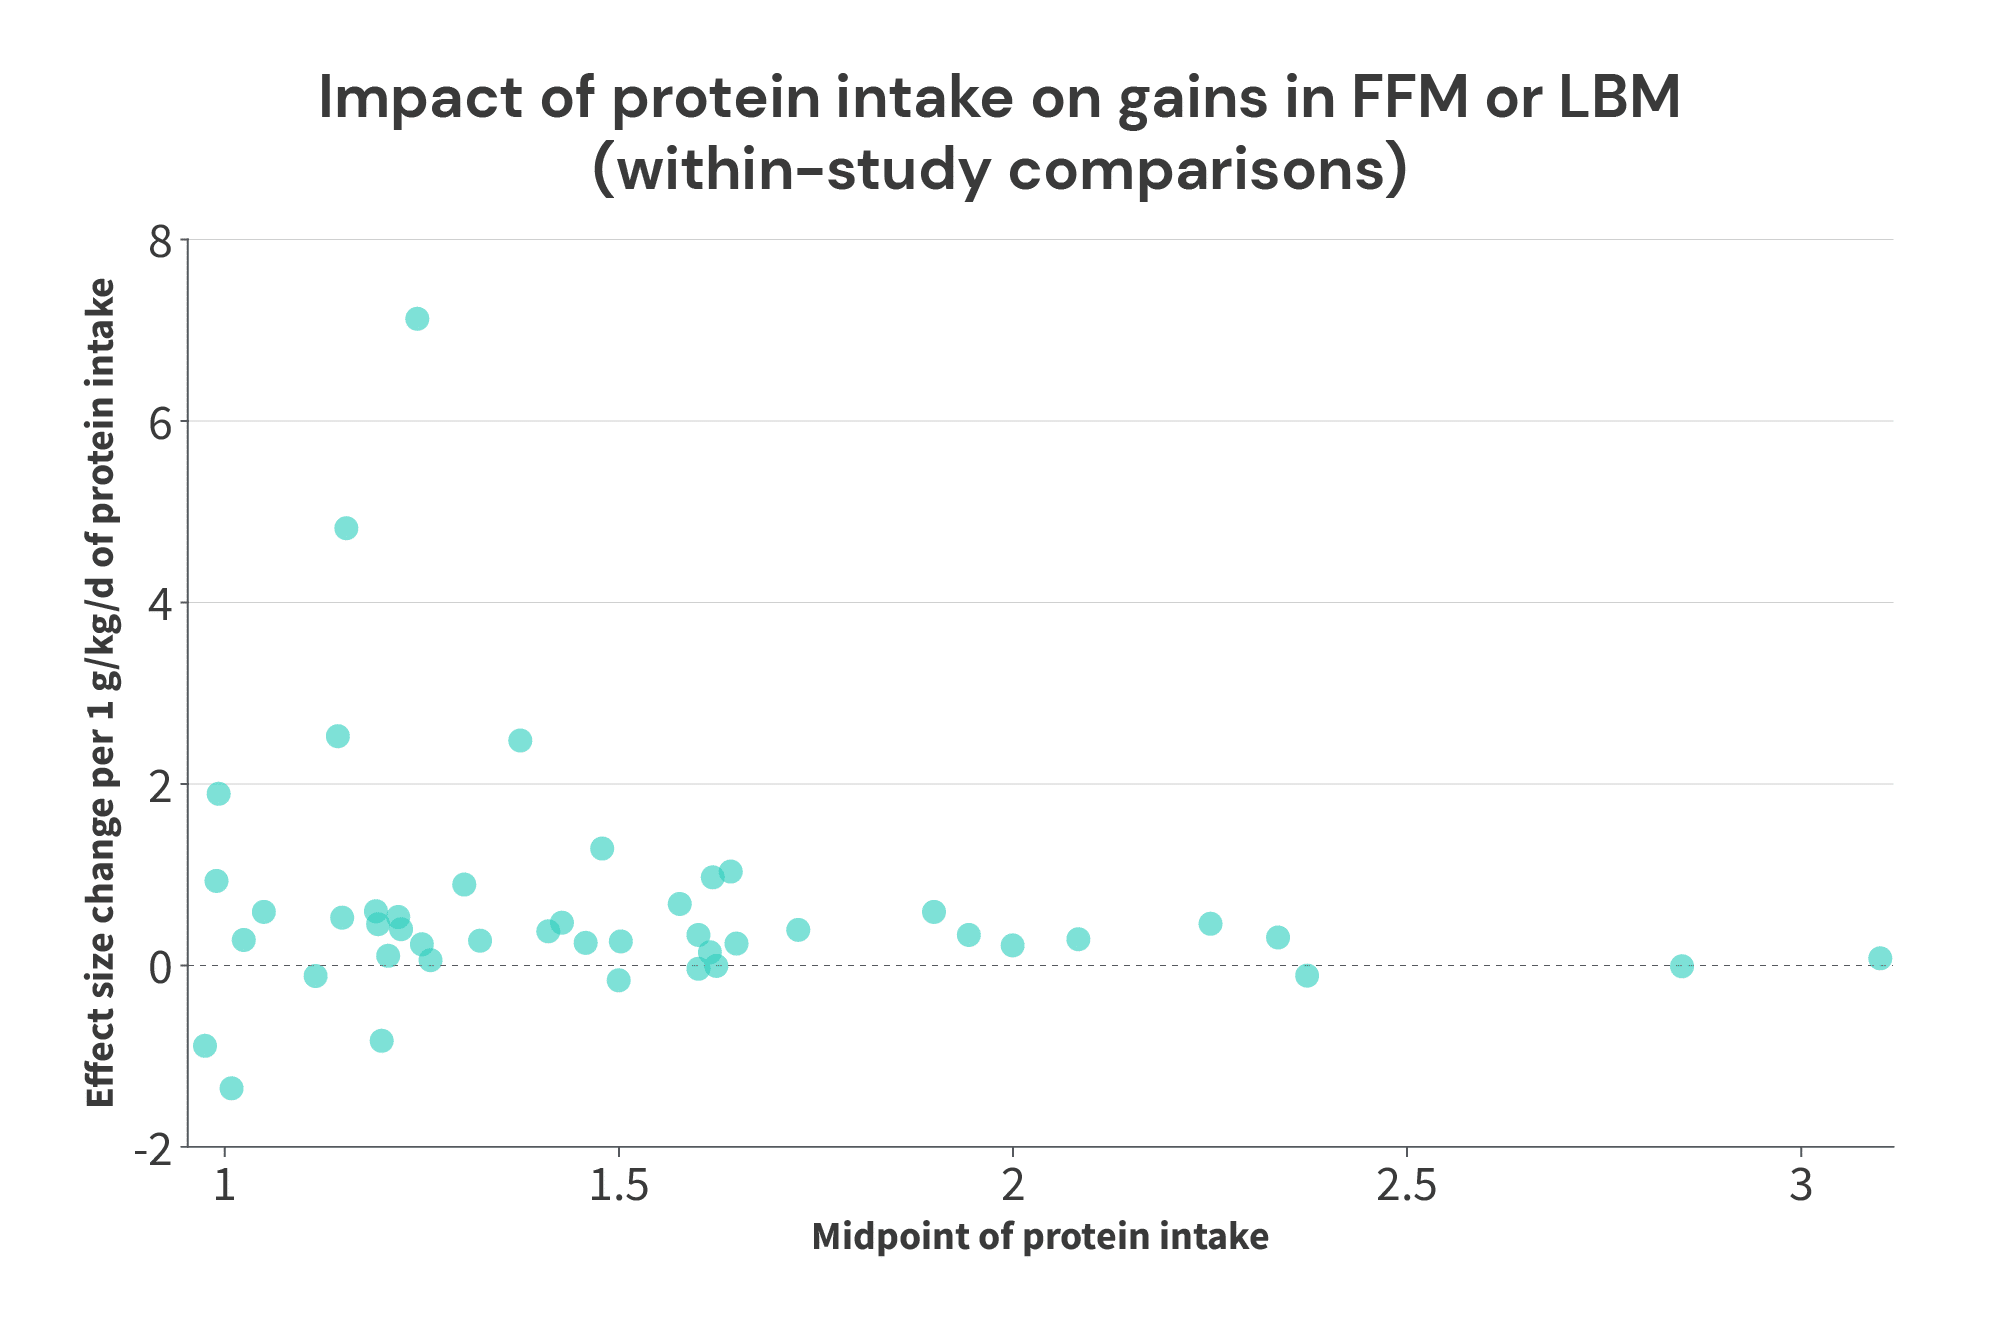

So, what do we see?
For starters, we certainly see that the returns on increasing protein intake probably get smaller as total protein intake increases. The average effect size slope with protein intakes below 1.5g/kg was 0.88, the average effect size slope with protein intakes of 1.5-1.99g/kg was 0.38, and the average effect size slope with intakes at or above 2g/kg was 0.19. So, if you increase your protein intake from 1.0 to 1.5g/kg, you’ll probably get a pretty big payoff. Further increasing your protein intake from 1.5 to 2.0g/kg would likely still yield benefits, but the benefits would be quite a bit smaller. Further increases above 2.0g/kg may still yield some additional benefits, but the additional gains will be smaller yet.
| The additive benefits of increasing protein intake decrease at higher baseline levels of protein intake | |
| Protein intake | Average effect size slope |
| <1.5g/kg/day | 0.88 |
| 1.5-1.99g/kg/day | 0.38 |
| ≥2g/kg/day | 0.19 |
Furthermore, it appears that higher protein intakes are predictive of increases in fat-free mass up to around 2.3-2.4g/kg. In studies where the midpoint of protein intakes tested was below that point, we tend to see positive effects with increased protein intakes. In the three studies with even higher average protein intakes (Rozenek; Antonio, 2014; Antonio, 2015) we see effect size slopes of basically zero (between -0.11 and 0.10).
However, there are two important things to note about this analysis:
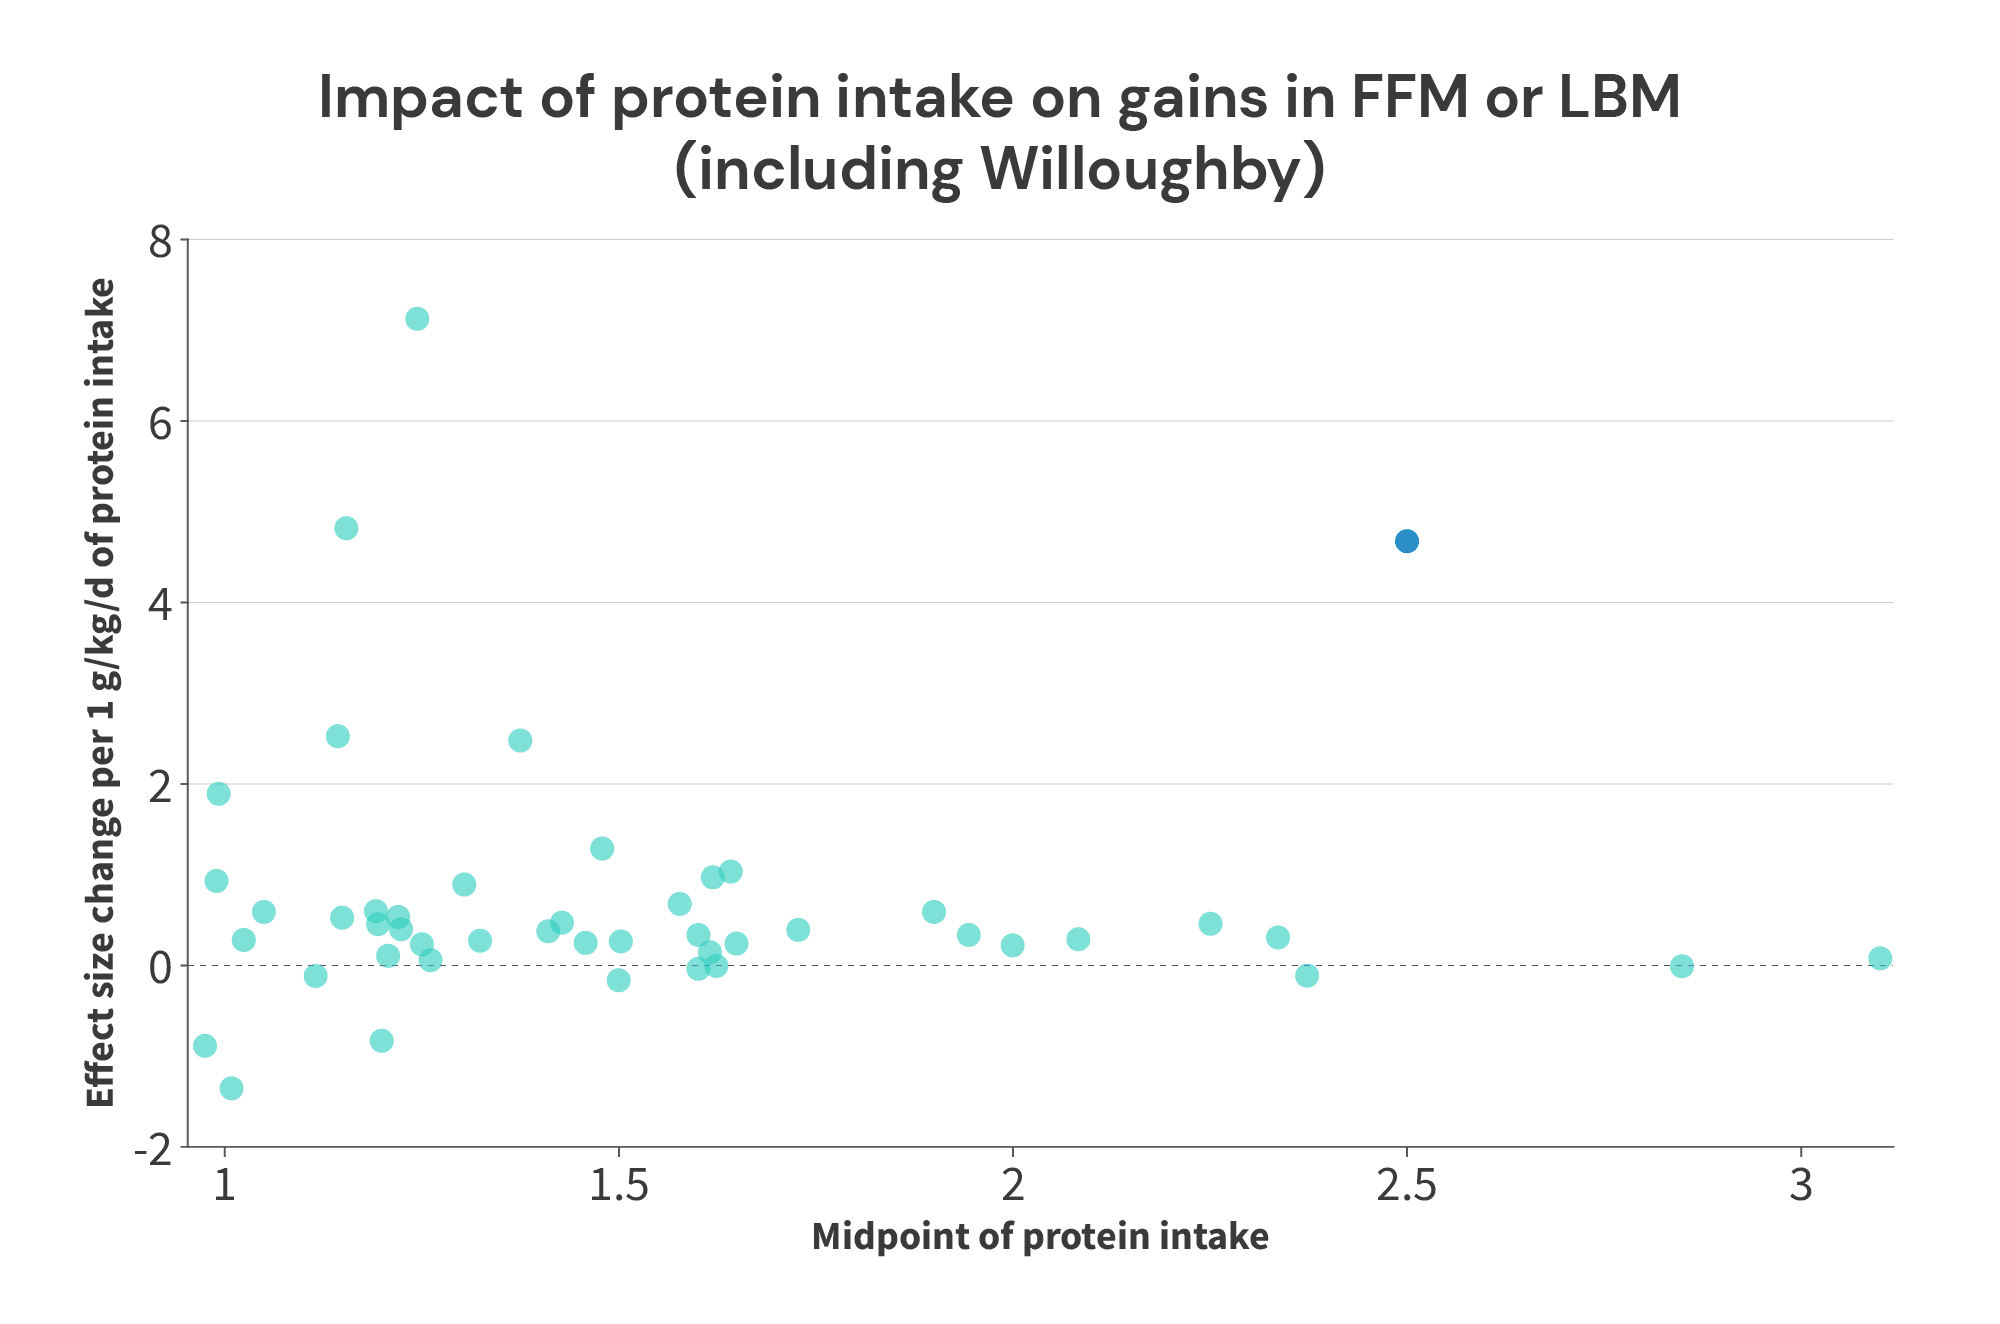
First, I did stack the deck in favor of finding a “breakpoint” by excluding the Willoughby study. Add that study back into the mix, and the picture changes dramatically. With the Willoughby study included, the third largest effect observed in any of these studies comes from a paper where a protein intake of 2.76g/kg beat the socks off of 2.24g/kg (average protein intake of 2.5g/kg, with a slope of 4.67 effect size units per 1g/kg of protein intake). At best, you might predict that there could be a breakpoint somewhere between 2.5g/kg and 2.85g/kg, but the picture is certainly a lot murkier.

Second, this analysis could introduce a positive bias if there is truly a breakpoint. For instance, let’s assume that protein intakes up to 2.2g/kg do increase muscle growth, but there’s a hard cutoff at 2.2g/kg: further increases past that point don’t yield further benefits. In this scenario, you could have Study A comparing 1.8g/kg to 2.2g/kg, and Study B comparing 1.8g/kg to 3.0g/kg. In both of these studies, you’d expect to observe a positive effect, but the effect is entirely driven by the increase in protein intake from 1.8g/kg to 2.2g/kg. The additional increase from 2.2g/kg to 3.0g/kg wouldn’t yield additional benefits.
In study A, you’d see a positive effect centered at 2.0g/kg, which is good! Over the range of 1.8-2.2g/kg, you should expect increases in protein intake to yield additional growth, so a positive effect centered at 2.0g/kg is spot-on.
However, in Study B, you’d see a positive effect centered at 2.4g/kg, which isn’t ideal. With the benefit of knowing the assumptions behind this illustration, we know that all of the additional growth observed with increased protein intakes were due to the increase from 1.8g/kg to 2.2g/kg. The additional protein intake (from 2.2g/kg to 3.0g/kg) yielded no additional benefits. However, we wouldn’t know that unless we already knew there was a hard breakpoint at 2.2g/kg. So, we’d plot a positive effect at 2.4g/kg, which would make it appear that intakes above 2.2g/kg still had positive effects on muscle growth.
So, where does that leave us?
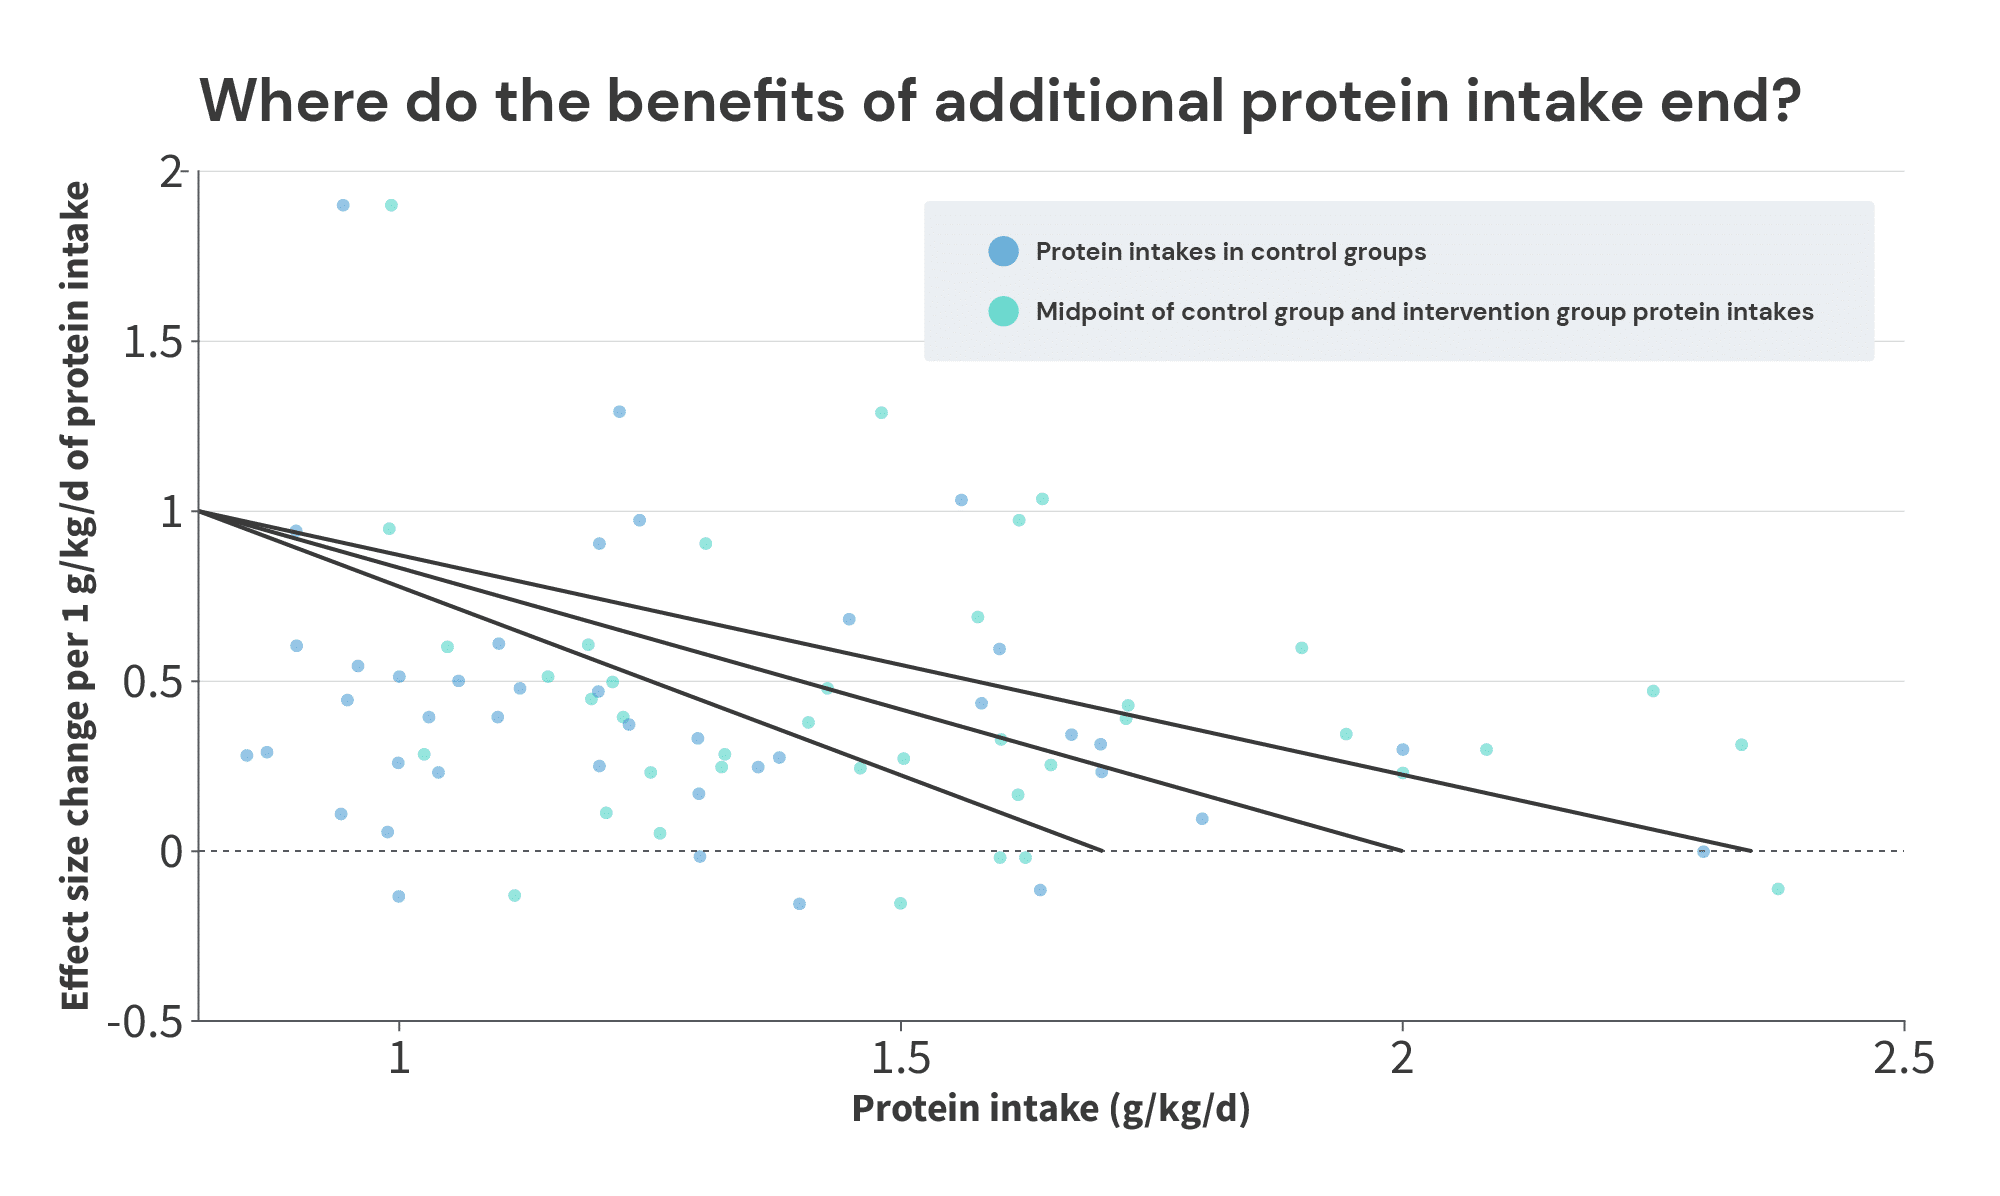
It actually leaves us pretty close to a tentative conclusion, with just one more set of analyses. Previously, we plotted the relationship between protein intake in control groups, and the effect sizes associated with increases in protein intake. Positive effects in that analysis inherently mean that additional protein intake can yield further increases in FFM. So, identifying where the positive effects tail off can give us an idea of the lowest plausible value for the breakpoint (i.e., this will likely underestimate the “true” breakpoint). Conversely, the analysis I just presented may be somewhat positively biased in situations where a study tests a level of protein intake that’s well beyond the breakpoint. So, identifying where the positive effects tail off can give us an idea of the highest plausible value for the breakpoint (i.e., this will likely overestimate the “true” breakpoint).
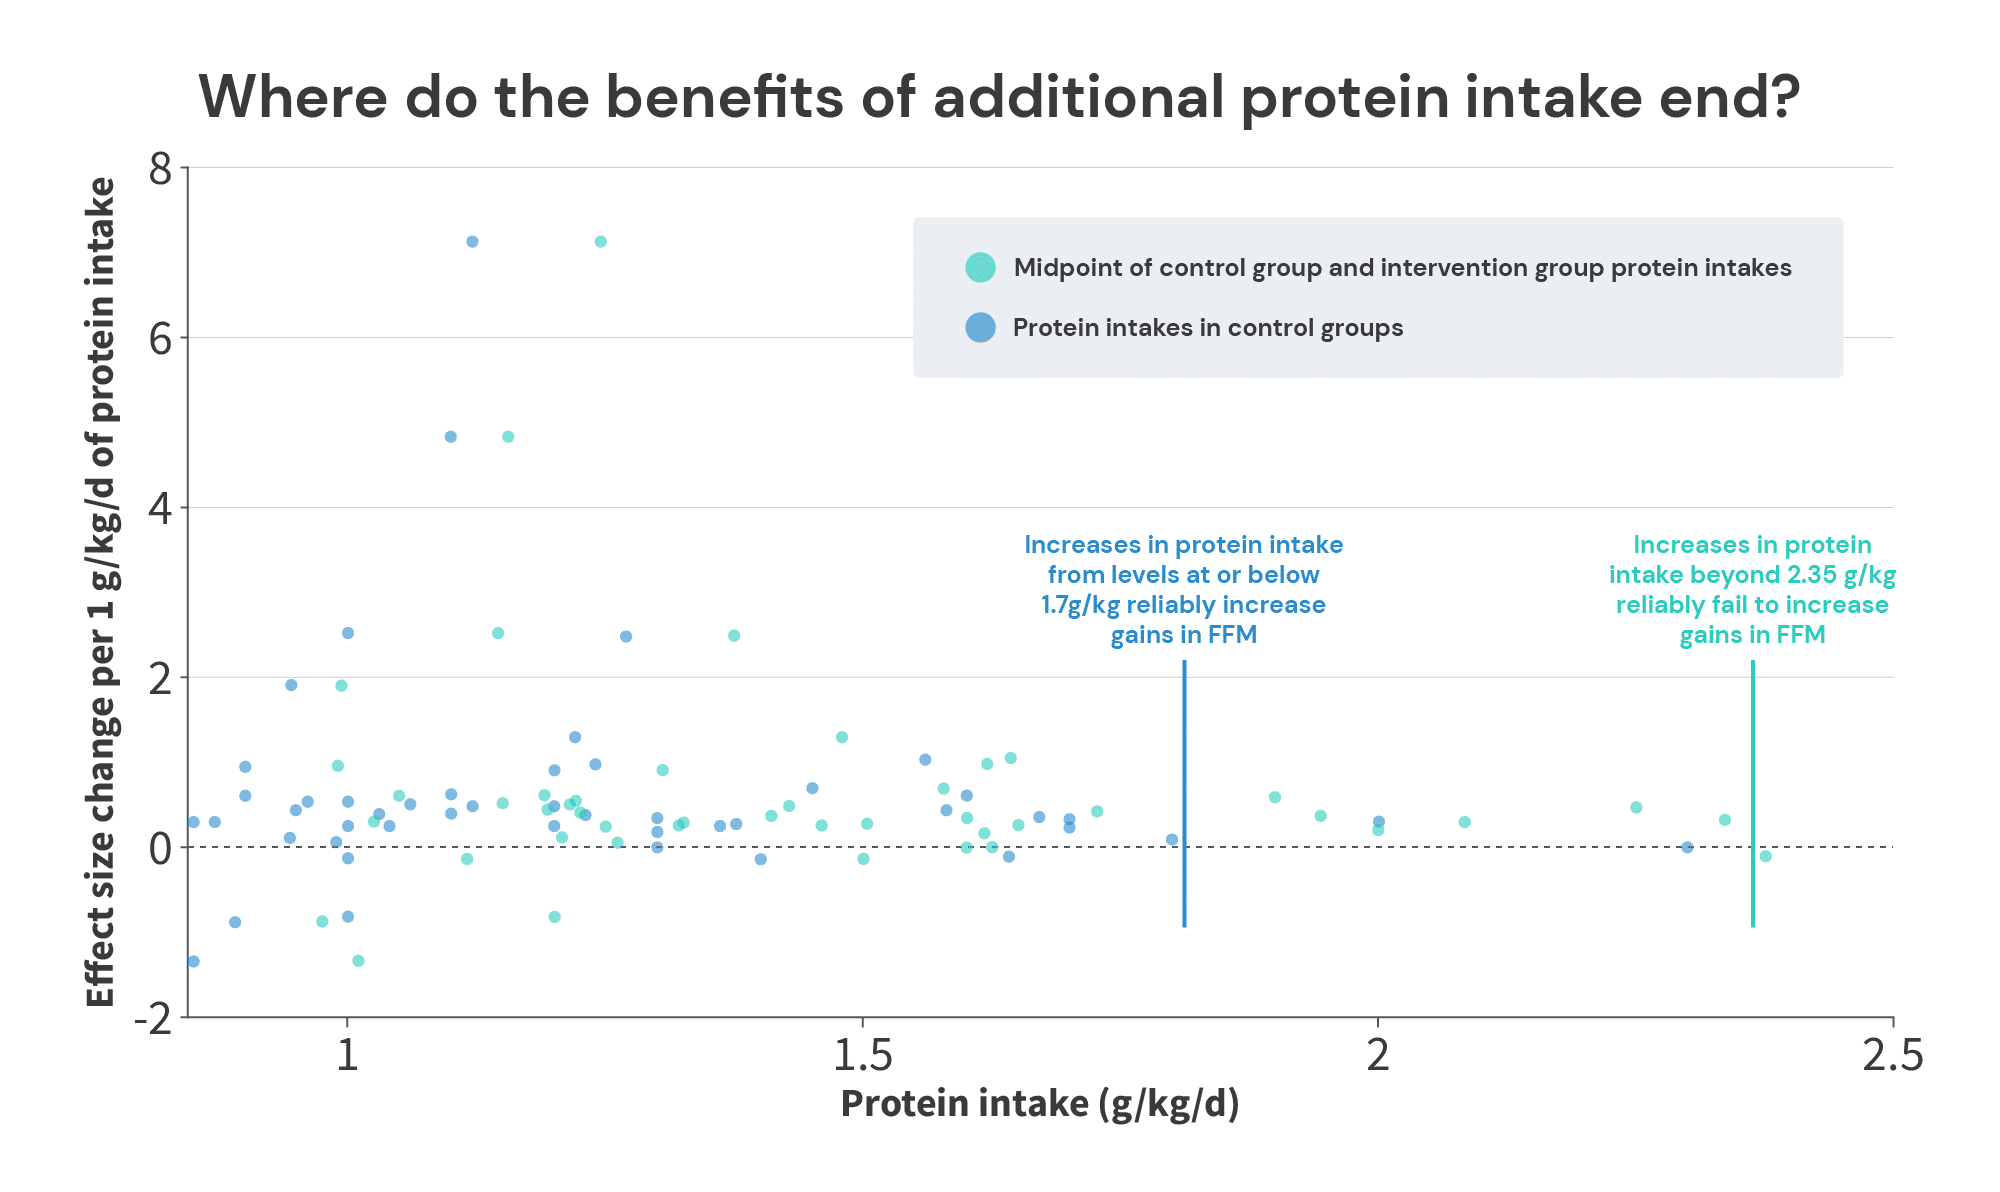

When looking at the protein intakes and effect sizes in the control groups (blue dots), we see plenty of positive effects up to 1.7g/kg, and we hit an effect of 0 at 2.3g/kg. So, the bottom end of the range is somewhere between 1.7g/kg and 2.3g/kg. Where you draw the line largely depends on how you view two studies by Antonio and Sharpe.
In the study by Antonio, the control group consumed 1.8g/kg of protein, and the high-protein group consumed 4.4g/kg of protein for 8 weeks. On average, the high-protein group gained 0.6 additional kilos of fat-free mass, compared to the control group (1.9 vs. 1.3kg). However, this study was poorly controlled – the subjects were already well-trained lifters (with an average of nearly 9 years of training experience, training for an average of 8.5 hours per week), and the researchers simply instructed them to stick to their normal training habits for the duration of the study. I understand the decision; it’s notoriously difficult to get serious lifters to turn their training over to a team of researchers for an extended period of time. And, if you wanted to design and monitor standardized workouts that would roughly match the subjects’ normal training habits, that would introduce a large subject burden, and it would mean you’d need research assistants to administer around 2000 total hours of workouts. So, there’s something to be said for the pragmatism and ecological validity of the study design (in the “real world,” if you recommend that people increase their protein intake, they’ll be increasing their protein intake while continuing with their current training habits), but it does make it more challenging to conclude that the differences between groups were solely attributable to the differences in protein intake.
In the study by Sharpe, subjects in four groups completed a standardized 8-week training program. One group (the control group) received a maltodextrin supplement, and the other three groups all received protein supplements (whey, beef, or chicken protein). The three protein supplement groups all achieved larger gains in lean body mass than the control group (1.0kg in the control groups, versus 2.4, 1.9, and 2.1kg in the three supplement groups), despite the fact that the control group was already consuming 2 grams of protein per kilogram of body mass. However, it was an industry-funded study from a research group that had a particularly notorious track record for achieving eye-popping (perhaps even credulity-straining) results in industry-funded supplement studies.
So, where you put the lower boundary is a bit of a judgment call, depending on how you view these two studies. You’d be entirely justified in placing it at 1.7g/kg (since we see a few examples of increases beyond 1.7g/kg yielding further growth, but you may not feel entirely confident about the studies finding additional growth with intakes beyond 1.8g/kg and 2.0g/kg). Or, you could make a case for 2.3g/kg if you have an optimistic view of the lab that produced the Sharpe study, and the lack of training controls in the Antonio study don’t bother you. Personally, I’m happy to be conservative and place the lower boundary at 1.7g/kg.
The upper boundary is more straightforward. We see consistent positive effects with average protein intakes (the midpoint between the low and high intake in each study) up to 2.34g/kg (in a study by Candow and colleagues), and our first negative effect with average intakes at 2.38g/kg (in a study by Rozenek and colleagues).
Now, if you wanted to quibble, you could argue that the Rozenek study was an aggressive weight gain study in totally untrained lifters, so its results may not be applicable. Subjects in two groups were instructed to maintain their normal diets, while also consuming a ~2000 Calorie supplemental shake each day. The shake for one group consisted primarily of additional carbohydrate, and the shake for the other group was a carbohydrate/protein blend. The subjects in both of these groups gained about 3kg of body mass with virtually no change in fat mass – the subjects in the carbohydrate group just gained slightly more than 3kg of FFM, and the subjects in the protein/carbohydrate group just gained slightly less than 3kg.
But, you could look at the results and conclude that protein intake was never going to be a limiting factor in the first place: these subjects were ready to grow like weeds, and just needed additional calories from any source to fuel their gains. Since they barely gained any fat, you could make the case that additional protein shouldn’t have been expected to impact their results unless they increased their energy intake even more, and tried to bulk even faster, until reaching the point that protein intake became a limiting constraint (so, in effect, you’d hypothesize that the rate at which the subjects could gain weight without gaining fat would be greater with higher protein intakes). Or, you could simply argue that protein intake requirements are lower in an energy surplus than at (roughly) energetic maintenance, and since this was the only study that included an intentional, large energy surplus, it should be disregarded for that reason.
I personally don’t find either of those arguments to be particularly persuasive. They sound logical, but they’re both predicated on several untested assumptions. I’m much more comfortable dealing with results from studies that have actually occurred, rather than the assumed results of slightly different studies that haven’t actually occurred.
So, I’m going to tentatively place the upper end of the plausible range for the breakpoint (the point past which additional protein intake fails to further increase muscle growth) at 2.35g/kg.
So now, the moment of truth: at what point does increasing protein intake fail to lead to additional increases in fat-free mass or lean body mass?
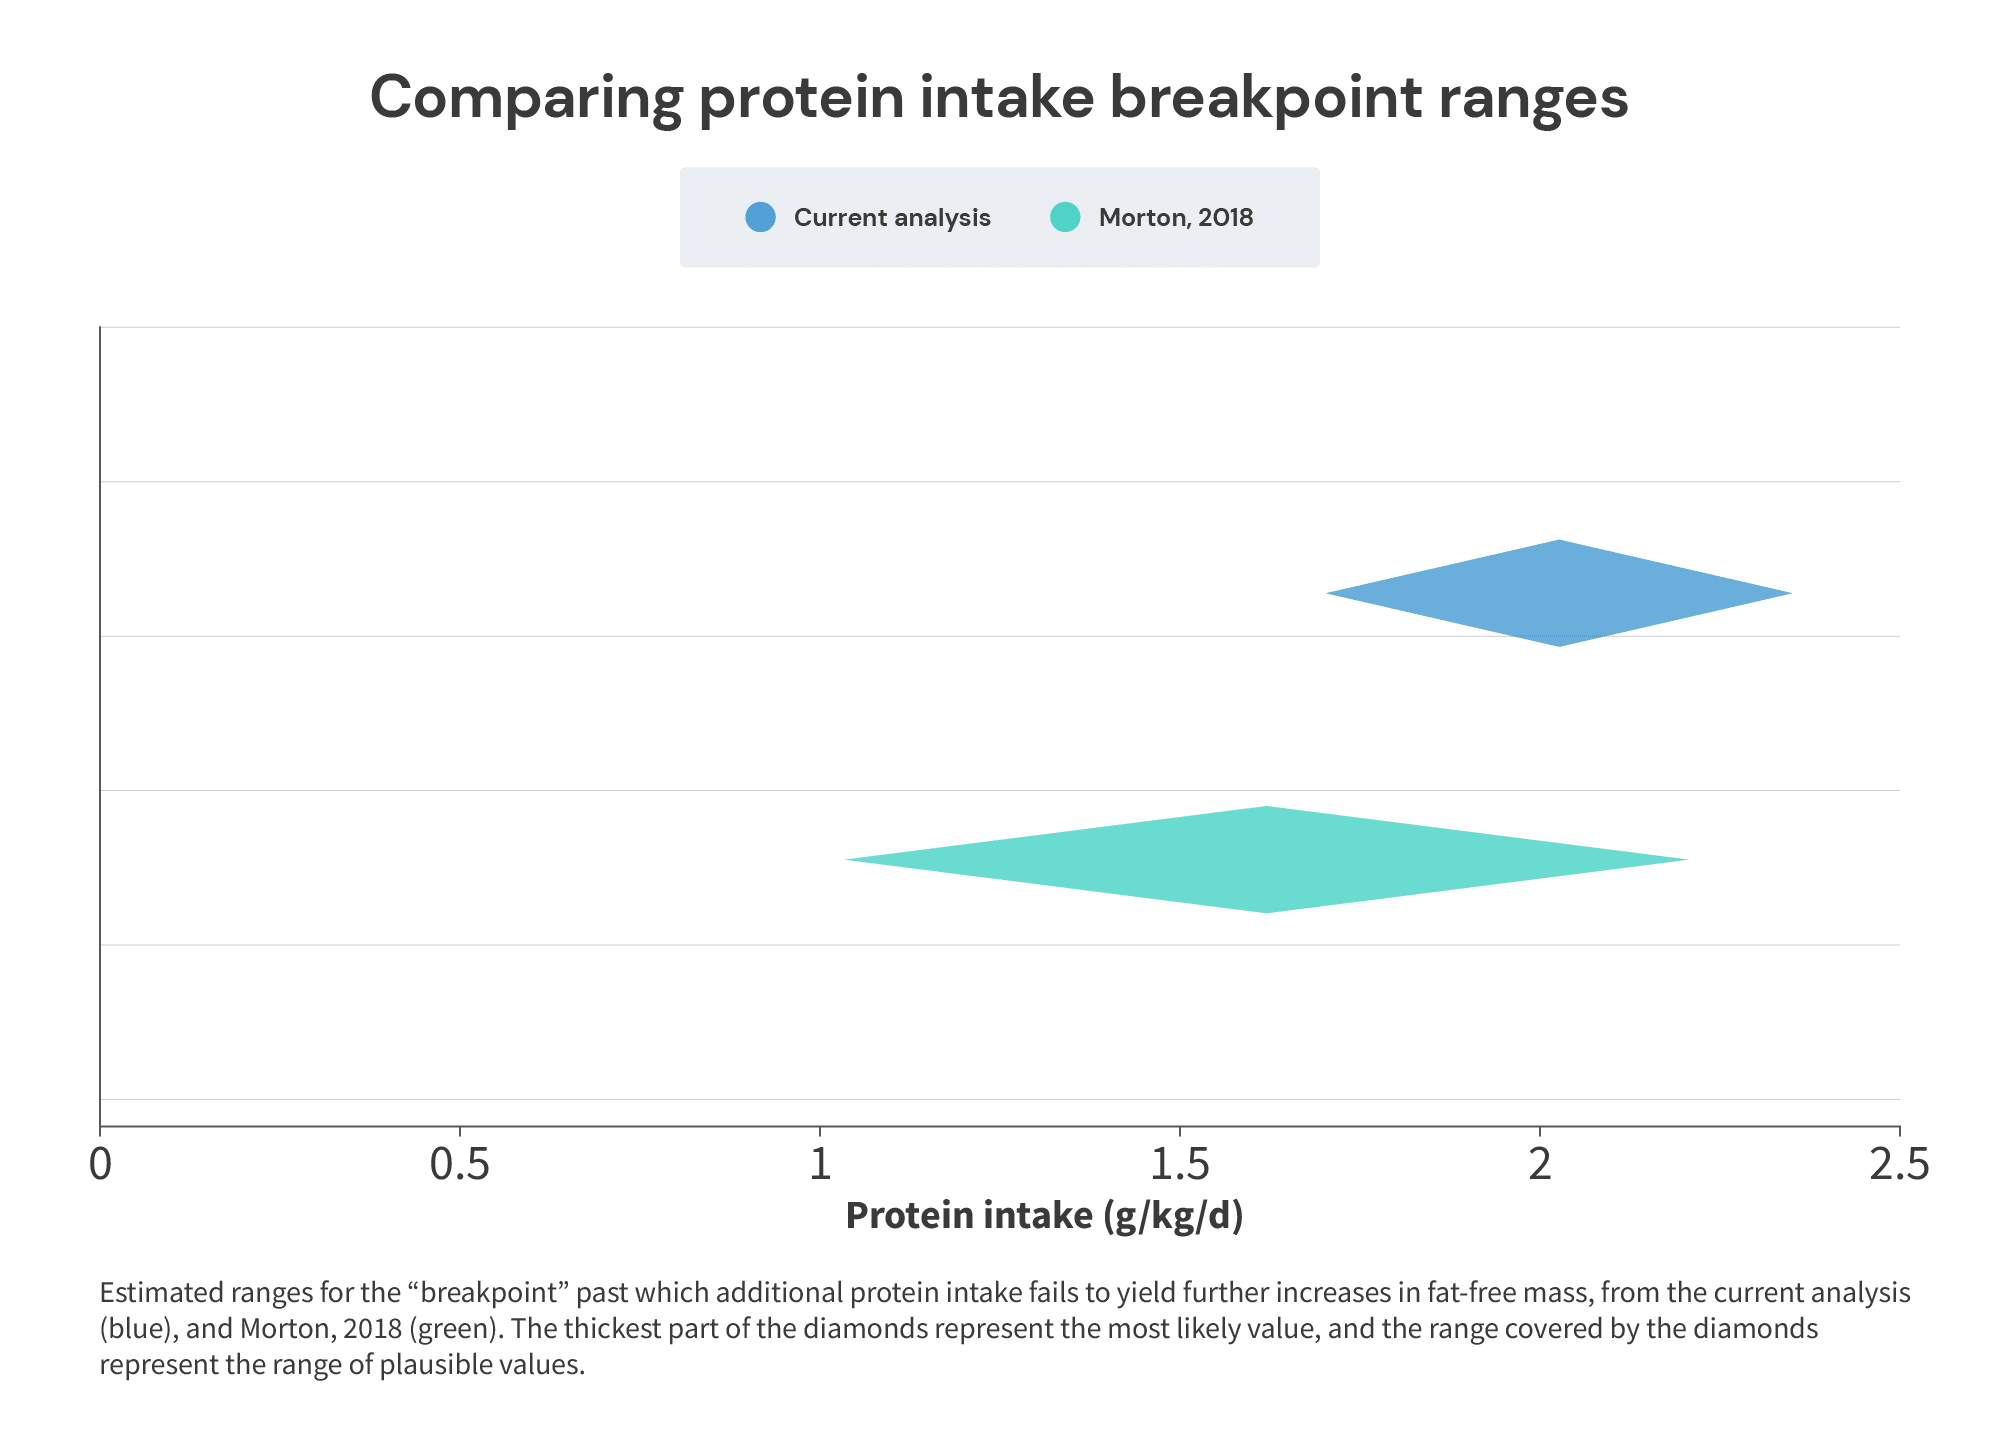
The famous Morton meta-analysis suggested that the breakpoint is at 1.62g/kg, with a plausible range for the breakpoint spanning from 1.03-2.2g/kg. This has been distilled down to the recommendation that lifters should aim for 1.62g/kg, and 2.2g/kg is a “better safe than sorry” intake.
However, my best accounting of this body of research suggests that the most likely breakpoint (if one exists) is at around 2.0g/kg, with a plausible range for the breakpoint spanning from 1.7-2.35g/kg. So, if you distilled it down in the same way, you’d recommend that lifters should aim to consume between 2.0g/kg and 2.35g/kg of protein.

But wait, there’s more!
There’s a famous quip, most frequently applied to economists: “Sure, it works in practice, but does it work in theory?”
To this point, I’ve focused exclusively on research investigating longitudinal outcomes: when people consume differing amounts of protein for an extended period of time, at what point do we stop observing differences in fat-free mass accretion?
However, it would also be extremely convenient if protein recommendations derived from longitudinal studies were similar to protein recommendations derived from acute studies that estimate daily protein requirements. If, for instance, acute studies suggested that only 1g/kg of protein is required to maximize daily protein balance, or if they suggested that 3g/kg is required to maximize daily protein balance, we’d have a small conundrum on our hands. But, if acute and longitudinal studies settle at similar values, that concordance would allow us to have considerably more confidence in the resulting recommendations.
Previously, nitrogen balance studies were the gold standard for estimating protein requirements acutely. In a nitrogen balance study, researchers provide food containing a known amount of nitrogen (i.e. protein) to subjects. Then, after a two-week period of consuming a fixed amount of nitrogen, the researchers collect the subjects’ urine and feces for 3-5 days, since most nitrogen is either lost in the feces, or excreted in the urine. Then they repeat this process with several other levels of nitrogen intake (two weeks of constant nitrogen feeding, with 3-5 days of urine and feces collection). Finally, they measure the nitrogen present in the urine and feces at each level of nitrogen intake, with the goal of estimating when nitrogen balance is equal to zero (i.e., the point at which nitrogen excretion equals nitrogen intake).
However, nitrogen balance studies have several drawbacks.
The first is simply that they’re expensive, time-consuming, and … a little gross. If you want to test three levels of protein intake, each subject has to participate and comply with the test diets for six weeks, the researchers have to provide meals to each subject for six weeks, the subjects need to collect all of their pee and poop for 9-15 days in total, and the researchers have to process a lot of pee and poop (and sometimes sweat) from all of the subjects.
The second drawback is that the researchers aren’t going to be able to collect all of the nitrogen excreted. While urine and feces account for >95% of nitrogen excretion, the body also excretes nitrogen through the skin (ammonia in sweat), via exhalation (also ammonia), and through hair, nails, saliva, mucous, and semen. So, you necessarily have to make some assumptions about how much nitrogen you’re not collecting in order to estimate total nitrogen balance.
The third major drawback compounds the second drawback: the line between nitrogen balance and imbalance is very difficult to ascertain, because total nitrogen intake and total nitrogen excretion are simply much larger values than the difference between intake and excretion. To illustrate, if you’re in a state of slight nitrogen imbalance, you might consume 16,000mg of nitrogen per day (the amount of nitrogen in approximately 100g of protein) and excrete 15,500mg of nitrogen per day, for a difference of just 500mg (i.e., the difference is nearly two orders of magnitude smaller than the intake and excretion values). So, if subjects are consuming slightly more or less nitrogen than researchers think, or if assumptions about unmeasured nitrogen losses are off by a fairly small amount, you could easily be at nitrogen balance when data suggests you’re still in a nitrogen deficit, or your actual nitrogen deficit might be twice as large as your data suggests.
The fourth major drawback is that the nitrogen balance technique is known to overestimate nitrogen intake and underestimate nitrogen losses. The upshot is that the levels of protein intake that are actually required to achieve nitrogen balance are higher than the protein intake levels suggested by the nitrogen balance technique. To quote a review paper from Tomé and Bos, “it is well recognized that the nitrogen balance technique overestimates N intake and underestimates N losses. This is mainly due to the difficulty in assessing N gas losses after denitrification by the colonic microflora, N losses through the skin (urea) and expired air (ammonia) and the nitrate content in food and urine, which is not measured using the Kjeldahl method.”
The fifth major drawback – at least for lifters – is that the nitrogen balance technique assumes that positive nitrogen balance is merely an artifact in the absence of significant weight gain. In other words, the technique isn’t designed to estimate the point at which rates of nitrogen accretion are maximized. It’s merely designed to estimate how much nitrogen you need to consume to not lose lean tissue. Now, to be clear, even when you’re building muscle fairly quickly, you shouldn’t expect to be in massively positive nitrogen balance. Let’s assume a new lifter gains 1.5kg of muscle in 10 weeks. About 20% of a muscle’s weight comes from protein, and protein is about 16% nitrogen by mass. So, building 1.5kg of muscle would require a total of 240,000mg of net nitrogen accretion, at a rate of about 685mg of nitrogen per day. At body weights ranging from 60-100kg, this rate of muscle growth would therefore require nitrogen accretion to occur at a rate of ~6.5-11.5mg/kg/day. When compared to a typical daily nitrogen flux of ~150-400mg/kg/day, such a small net positive balance would be virtually impossible to measure accurately. But, it’s worth emphasizing that nitrogen balance studies, by design, implicitly assume that apparent net nitrogen accretion is merely an artifact or a measurement error in most contexts. They’re not interested in identifying the level of protein intake required to maximize net protein anabolism – they’re merely interested in identifying the level of protein intake required to avoid net protein catabolism.
There’s now a much better technique for estimating protein requirements, which I’ll discuss in a moment. But, you may be curious why I spent so much time discussing the drawbacks of an outdated technique, if I’m not going to end up using nitrogen balance studies to draw inferences about acute protein needs. The reason is simple: some proponents of lower protein intakes lean heavily on nitrogen balance studies (while also still referring to nitrogen balance as an “unreliable method”) to support their contention that relatively low protein intakes are required to maximize muscle growth: one, two, three, four, five, six, seven.
So, nitrogen balance isn’t a great technique, but what’s better?
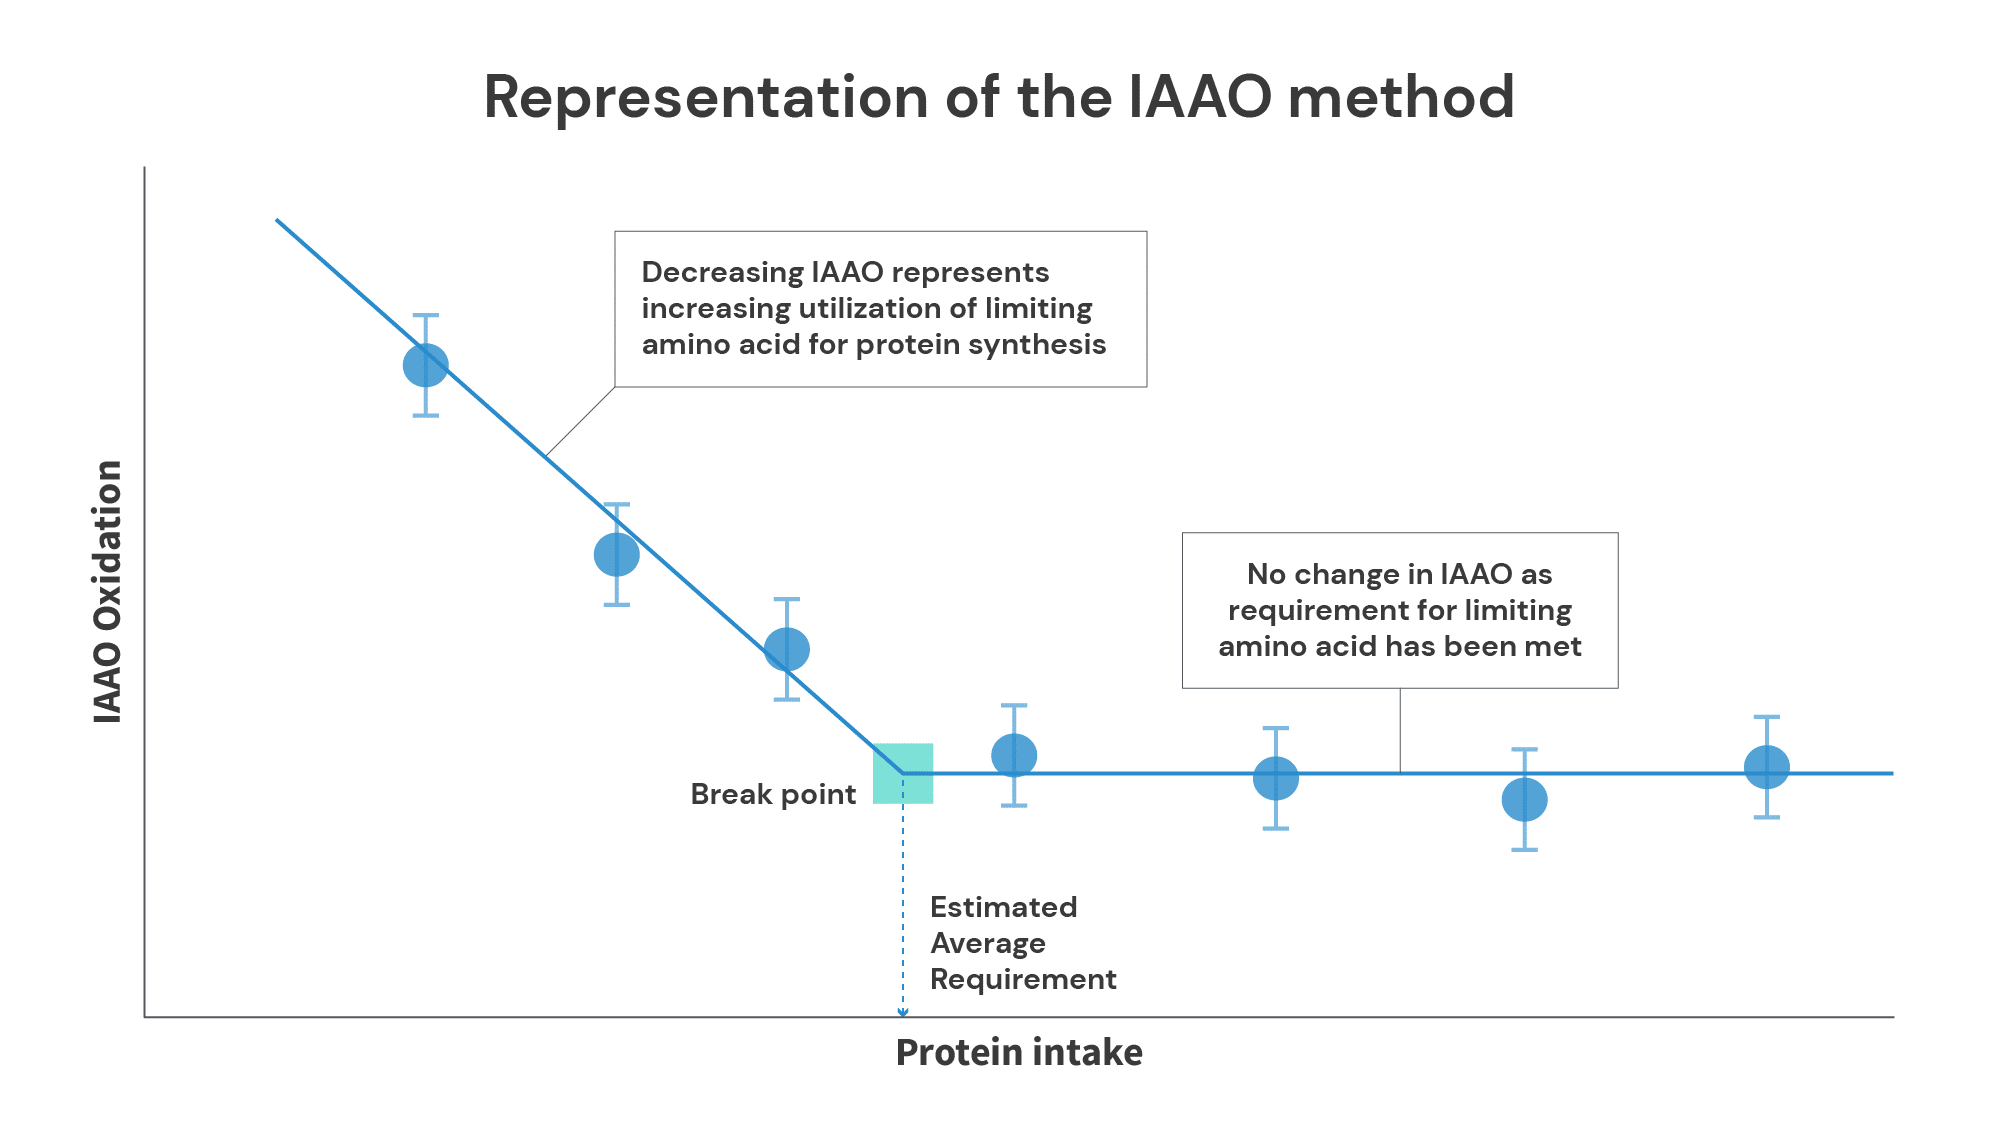
The Indicator Amino Acid Oxidation (IAAO) method is generally a superior method for estimating protein requirements. It’s based on a simple principle: your body will oxidize amino acids it can’t use. In short, subjects consume varying amounts of protein, but the intake of a single amino acid (usually phenylalanine) is held at a constant, elevated level. When you’re not consuming very much protein, overall levels of protein synthesis are lower, so you use very little of the indicator amino acid, and end up oxidizing the indicator amino acid at a high rate. As protein intake increases, protein synthesis also increases, so you can use more (and oxidize less) of the indicator amino acid. However, once you reach the point at which further increases in protein intake fail to yield further increases in protein synthesis, oxidation rates of the indicator amino acid plateau.

The IAAO method has several benefits over the nitrogen balance method.
First, the burden on both subjects and researchers is lower. Each level of protein intake can be tested in three days (one testing day and two washout days) rather than two weeks. Furthermore, subjects don’t have to collect their urine and feces, and researchers don’t have to process loads of urine and feces.
Second, you don’t need to worry about making a ton of assumptions about routes of nitrogen excretion you can’t directly measure. With the IAAO method, it doesn’t matter if the protein you oxidize winds up in your urine, your sweat, or your hair – all you need to know is the point at which the oxidation rate of your indicator amino acid plateaus.
Third, the IAAO method doesn’t rely on the assumption that net protein accretion is (essentially) impossible. If an individual isn’t capable of being in net positive protein balance, oxidation rates of the indicator amino acid will plateau at a level of protein intake corresponding to net neutral protein balance. If an individual is capable of being in net positive protein balance (i.e., if they’re in a state where protein synthesis exceeds protein breakdown), oxidation rates of the indicator amino will (or at least should) plateau at the level of protein intake that maximizes the rate of net protein accretion.
However, one small potential drawback of IAAO studies is that they may still slightly underestimate protein requirements. The protein mixture used in IAAO studies typically has the amino acid composition of eggs, and egg protein is one of the highest-quality proteins (meaning it’s easily digested, and has an amino acid composition that’s conducive for maximizing protein synthesis). In a typical diet, which contains a mix of higher- and lower-quality proteins, it’s possible that slightly higher levels of total protein intake would be required to maximize anabolism.
So, what do IAAO studies tell us about optimal protein intakes?
For starters, they tell us that nitrogen balance studies likely significantly underestimate human protein needs. This shouldn’t be too surprising (remember, nitrogen balance studies typically overestimate nitrogen intake and underestimate nitrogen excretion), but the size of the difference is fairly surprising.
The RDA (Recommended Dietary Allowance) for protein of 0.8g/kg came from an analysis of nitrogen balance studies. These studies suggested that the average protein intake required for people in the general population to achieve nitrogen balance was 0.66 ± 0.085 grams of protein per kilogram of body mass. An RDA is supposed to cover the needs of 95% of individuals, so to calculate an RDA, you add two standard deviations to the average requirement. Thus, the RDA for protein was calculated to be 0.83g/kg, which the USDA rounded down to 0.8g/kg (the World Health Organization also adopted a similar approach).
However, IAAO studies in the general population generally find that the average protein intake requirement is around 0.92g/kg, and the protein intake required to cover the needs of 95% of individuals is around 1.2g/kg. So, nitrogen balance studies likely underestimated protein requirements in the general population by ~40-50%! There’s every reason to suspect that the aforementioned nitrogen balance studies in lifters also underestimated protein requirements to a similar degree.
Now, what do IAAO studies have to say about the protein requirements for lifters?
We currently have three applicable studies: a 2017 study by Bandegan and colleagues looked at protein requirements for male bodybuilders on a non-training day, a 2019 study by Malowany and colleagues looked at protein requirements for resistance-trained females on a training day, and a 2020 study by Mazzulla and colleagues looked at protein requirements for resistance-trained men on a training day.
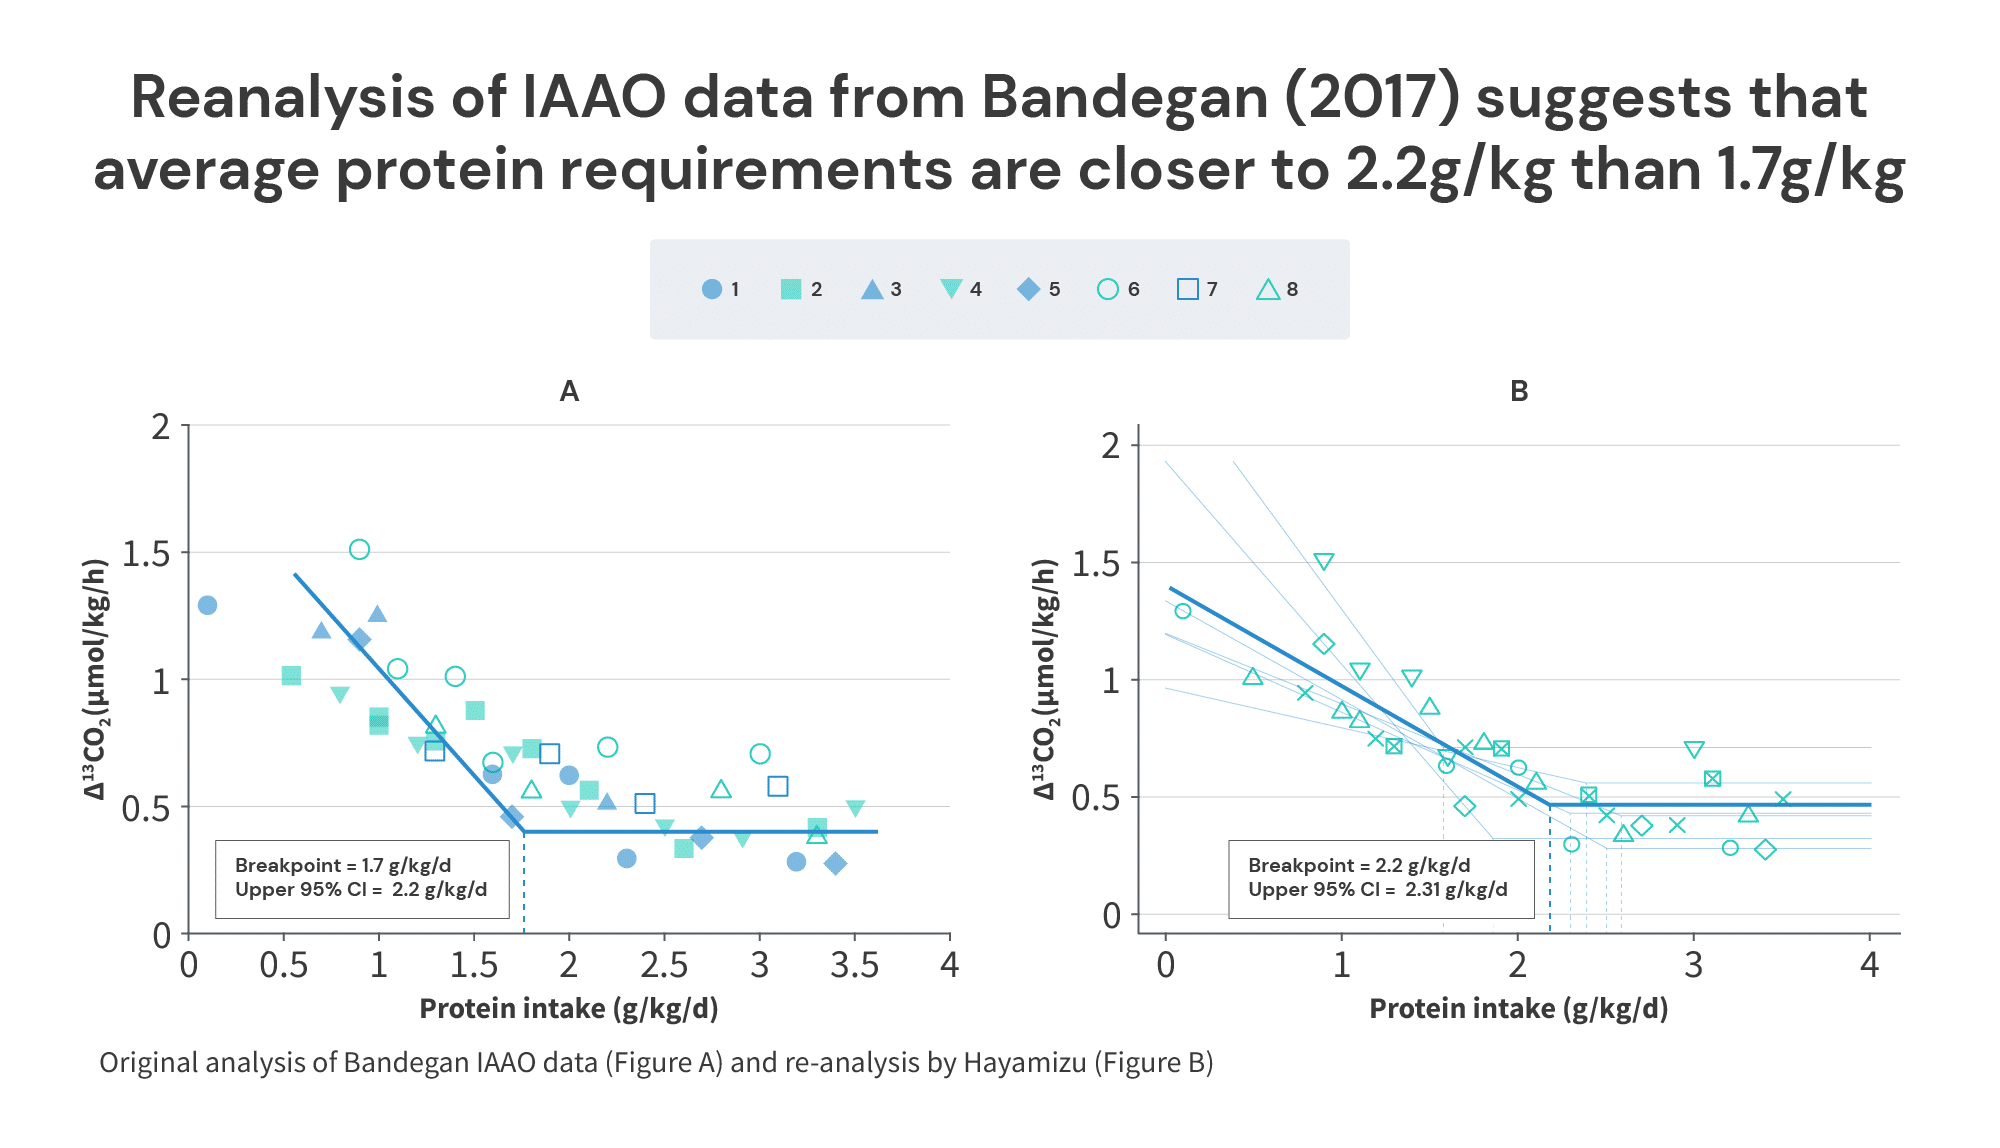
The Bandegan study found that the average protein intake required to maximize anabolism was 1.7g/kg of total body mass (2g/kg of fat-free mass), and the protein intake required to maximize anabolism in 95% of individuals was 2.2g/kg of total body mass (2.5g/kg of fat-free mass).
The Malowany study found that the average protein intake required to maximize anabolism was 1.49g/kg (2.13g/kg of fat-free mass), and the protein intake required to maximize anabolism in 95% of individuals was 1.93g/kg (2.78g/kg of fat-free mass).
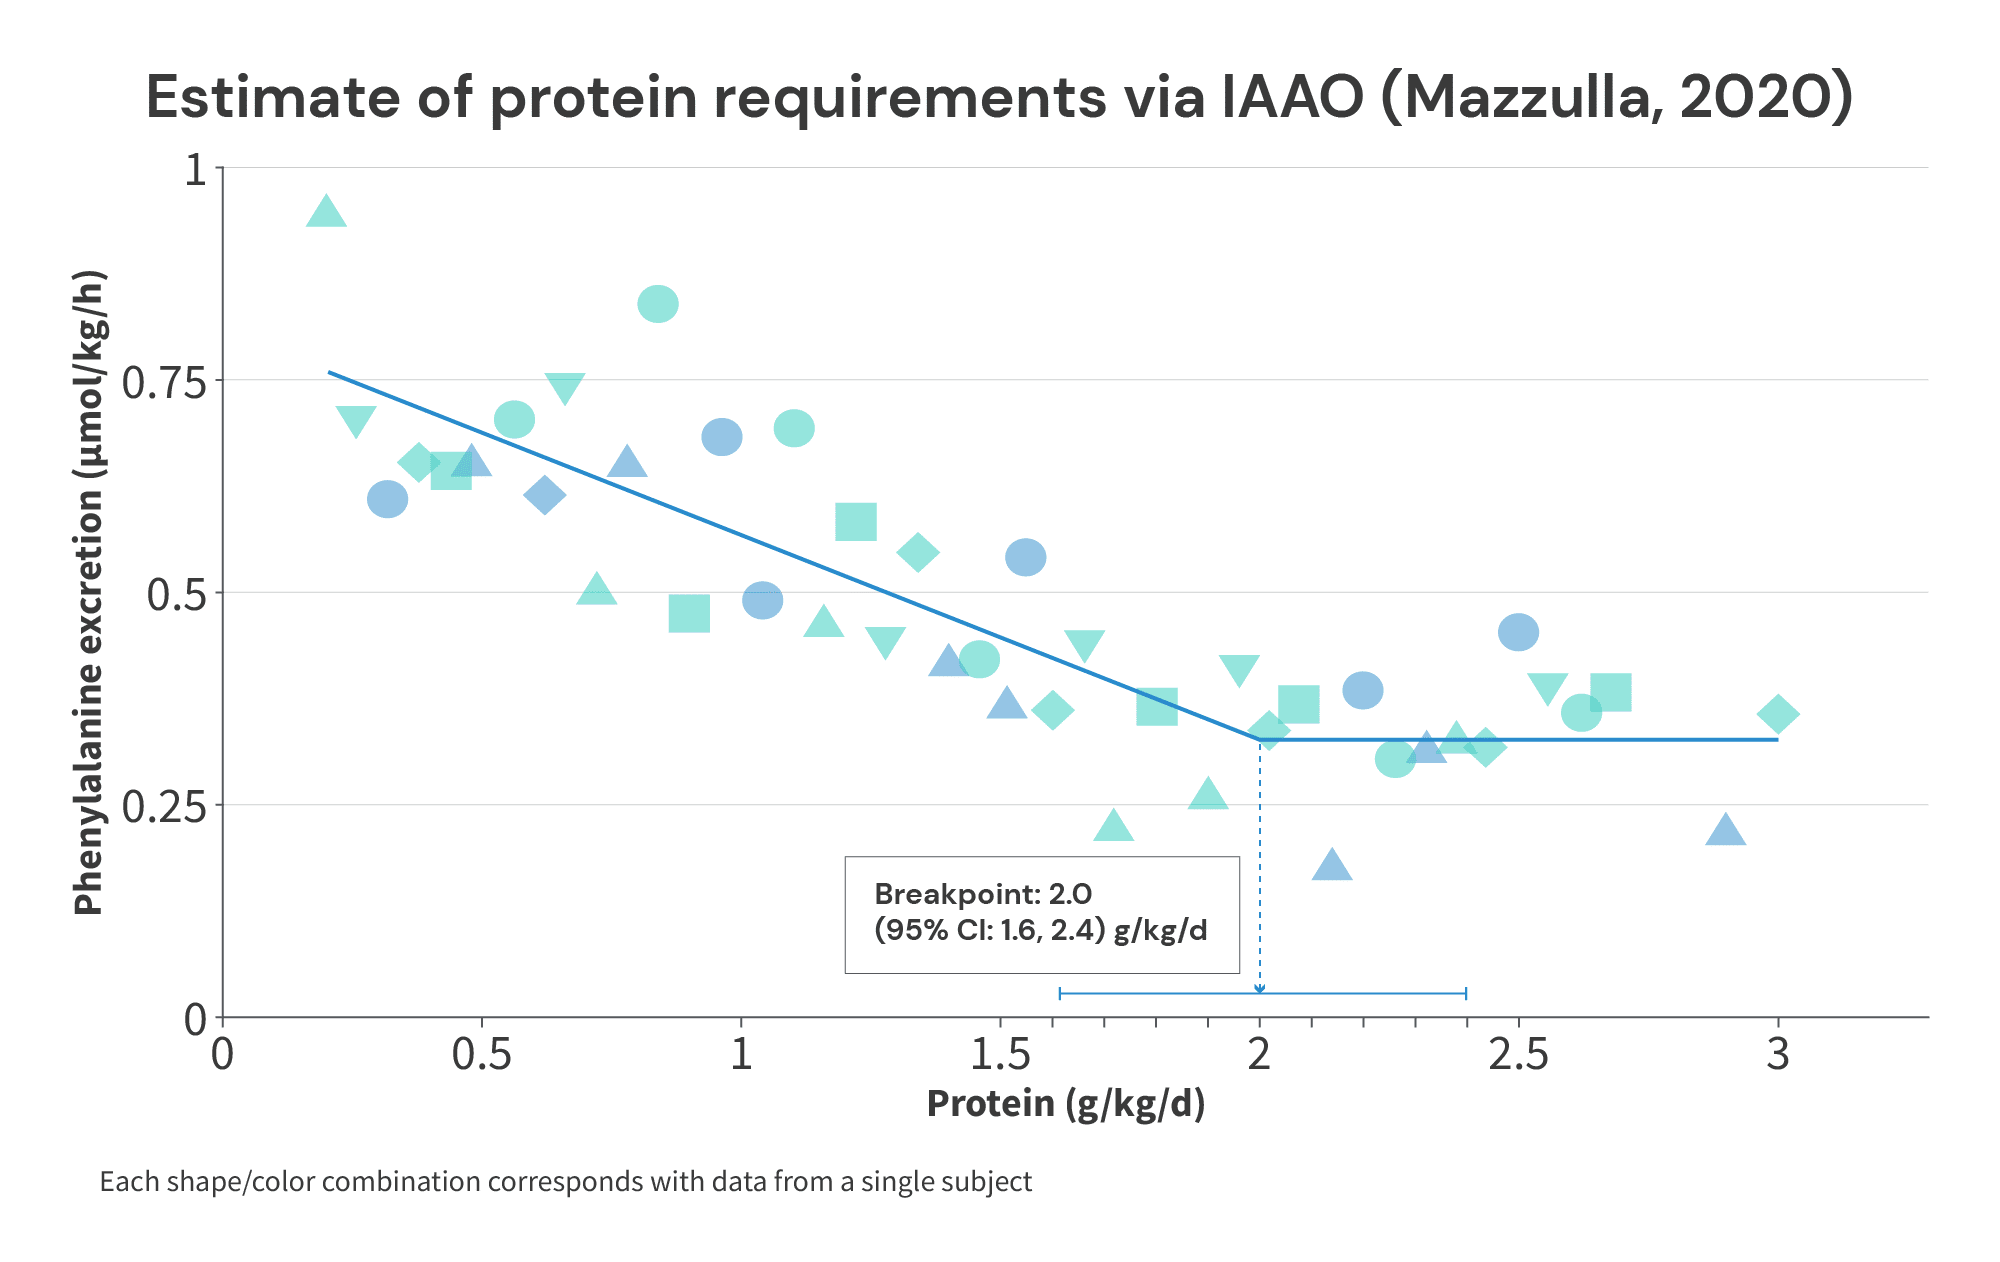
Finally, the Mazzulla study found that the average protein intake required to maximize anabolism was 2.0g/kg (2.35g/kg of fat-free mass), and the protein intake required to maximize anabolism in 95% of individuals was 2.38g/kg (2.9g/kg of fat-free mass).

Of note, these values compare favorably with the range of plausible breakpoints we derived from the longitudinal studies above. If you’ll recall, I suggested that a protein intake of at least 1.7g/kg is required to maximize muscle growth, with the plausible range extending up to 2.35g/kg. In these studies, we’re seeing average requirements of 1.49-2.0g/kg (which seem to be neatly clustered around 1.7g/kg), with the highest recommendation for maximizing anabolism in 95% of individuals stretching up to 2.38g/kg (suspiciously close to 2.35g/kg).


So, not only does a protein breakpoint of around 2.0g/kg (somewhere between 1.7-2.35g/kg) work in practice – it also appears to work pretty well in theory.
But, while I have you here, I do have a couple more quick notes.
First, a re-analysis of the individual results from the Bandegan study (finding the average break point for each subject and averaging those breakpoints, rather than finding a pooled breakpoint for all subjects) suggested that the average protein requirement was closer to 2.22g/kg of total body mass, with 2.31g/kg being required to maximize anabolism in 95% of individuals. This doesn’t materially affect any of the takeaways from the previous section, but I do think the analytical method used in the reanalysis (CPRM) seems like a better analytical approach. I just wanted to mention that, in case any people reading this decide to do some IAAO studies in the future.

Second, I think protein intake is a topic where inter-individual variability is under-discussed. Something we see in all of these IAAO studies (and that we previously saw in nitrogen balance studies) is that protein requirements may vary considerably between individuals. The coefficient of variation in IAAO studies seems to be around 20%, meaning the standard deviations for protein intake breakpoints are about 20% as large as the means. In other words, if the average protein requirement for lifters is around 2.0g/kg, the optimal protein intakes for individual lifters likely vary from ~1.6-2.4g/kg. This, once again, tracks pretty well with the ~1.7-2.35g/kg range derived from longitudinal studies.
Third, I strongly suspect that the optimal protein intake for women is around 10-15% lower than the optimal protein intake for men. Of the 50 longitudinal studies from the Nunes paper analyzed above, 25 (50%) used male-only cohorts, 16 (32%) used mixed-sex cohorts, and just 9 (18%) used female-only cohorts. Furthermore, none of the female-only studies used particularly high protein intakes: intakes in control groups ranged from 0.85-1.2g/kg, and intakes in experimental groups ranged from 1.17-1.48g/kg. In other words, all longitudinal studies testing protein intakes exceeding 1.5g/kg used male-only or mixed-sex cohorts. So, the entire breakpoint analysis was derived from studies on male-only or mixed-sex cohorts – the longitudinal data doesn’t tell us much about the protein intake required to maximize gains for women.


However, protein needs should scale with fat-free mass, since fat-free tissues (muscles and organs, primarily) are where protein turnover occurs. Since there are sex differences in body composition (primarily due to sex differences in essential body fat levels), women tend to have about 10-15% less fat-free mass than men at any given body weight. So, I’d expect that protein needs per unit of total body mass would reflect that difference. This suspicion is bolstered by the IAAO studies above, where average protein needs per unit of body mass were a bit lower in women (1.49g/kg in women versus 1.85g/kg in men), but protein needs per unit of fat-free mass were similar between the sexes (2.13g/kg of fat-free mass in women versus 2.17g/kg of fat-free mass in men).
Fourth, and related to point 3: I do think it makes the most sense to scale protein recommendations with fat-free mass, rather than total body mass. Unfortunately (but understandably), most protein recommendations are provided in terms of g/kg of total body mass, because most of the research on the topic expresses protein intake in terms of g/kg of total body mass. However, we can do some quick back-of-the-napkin math to get some rough guidelines. Most of the longitudinal studies testing high protein intakes use male-only cohorts, and most of the male subjects in those studies are around 15% body fat. So, a recommendation of 2g/kg of total body mass, with a range of 1.7-2.35g/kg of total body mass, can be roughly converted to a recommendation of 2.35g/kg of fat-free mass, with a range of 2.0-2.75g/kg of fat-free mass. This once again matches up pretty nicely with the IAAO studies. Of note, this range should be similar for both men and women.


Fifth, what is the actual relationship between protein intake and gains in fat-free mass implied by this analysis? I wanted to save this for the end as a payoff to everyone who made it this far.
To start with, if the benefits of additional protein top out between 1.7g/kg and 2.35g/kg (with 2.0g/kg being my best guess), and the effect size slopes associated with increased protein intake decrease as total protein intake increases, the graph below should roughly reflect the relationship between protein intake and effect size slopes. The top black line shows the relationship if the benefits top out at 2.35g/kg, the bottom line shows the relationship if benefits top out at 1.7g/kg, and the middle line shows the relationship if benefits top out at 2.0g/kg.

Next, we need to convert those effect size slopes to actual gains in FFM or LBM. Thankfully, the Nunes meta-analysis (which is where I extracted the data from) gives us a rough conversion from effect size units to gains in LBM: “Additional protein ingestion probably leads to a small increase in lean body mass (SMD = 0.22 … ). The change represents approximately 1.3-1.4 kg lean mass gain during the intervention compared with an average of ~0.8 kg gain in the placebo/control group (~0.5-0.7 kg difference between groups).”
In other words, an effect size of 0.22 roughly corresponded to a difference in LBM of approximately 0.6kg. So, we multiply the effect size slopes by 0.6/0.22 (or 2.7272…) to convert them to LBM slopes (gains in LBM per 1g/kg increase in protein intake).
Finally, all we need to do is select the point at which to center our plot. I decided to center it on a maximum amount of LBM accretion of 1.8kg. I made this selection for two reasons. First, that’s roughly the average amount of LBM or FFM gained in the groups consuming large amounts of protein in the longitudinal studies. Second, that value means that you’d expect to gain approximately no LBM when only consuming 0.8g/kg, which matches up nicely with the other meta-regressions on the topic.
So, without further ado:
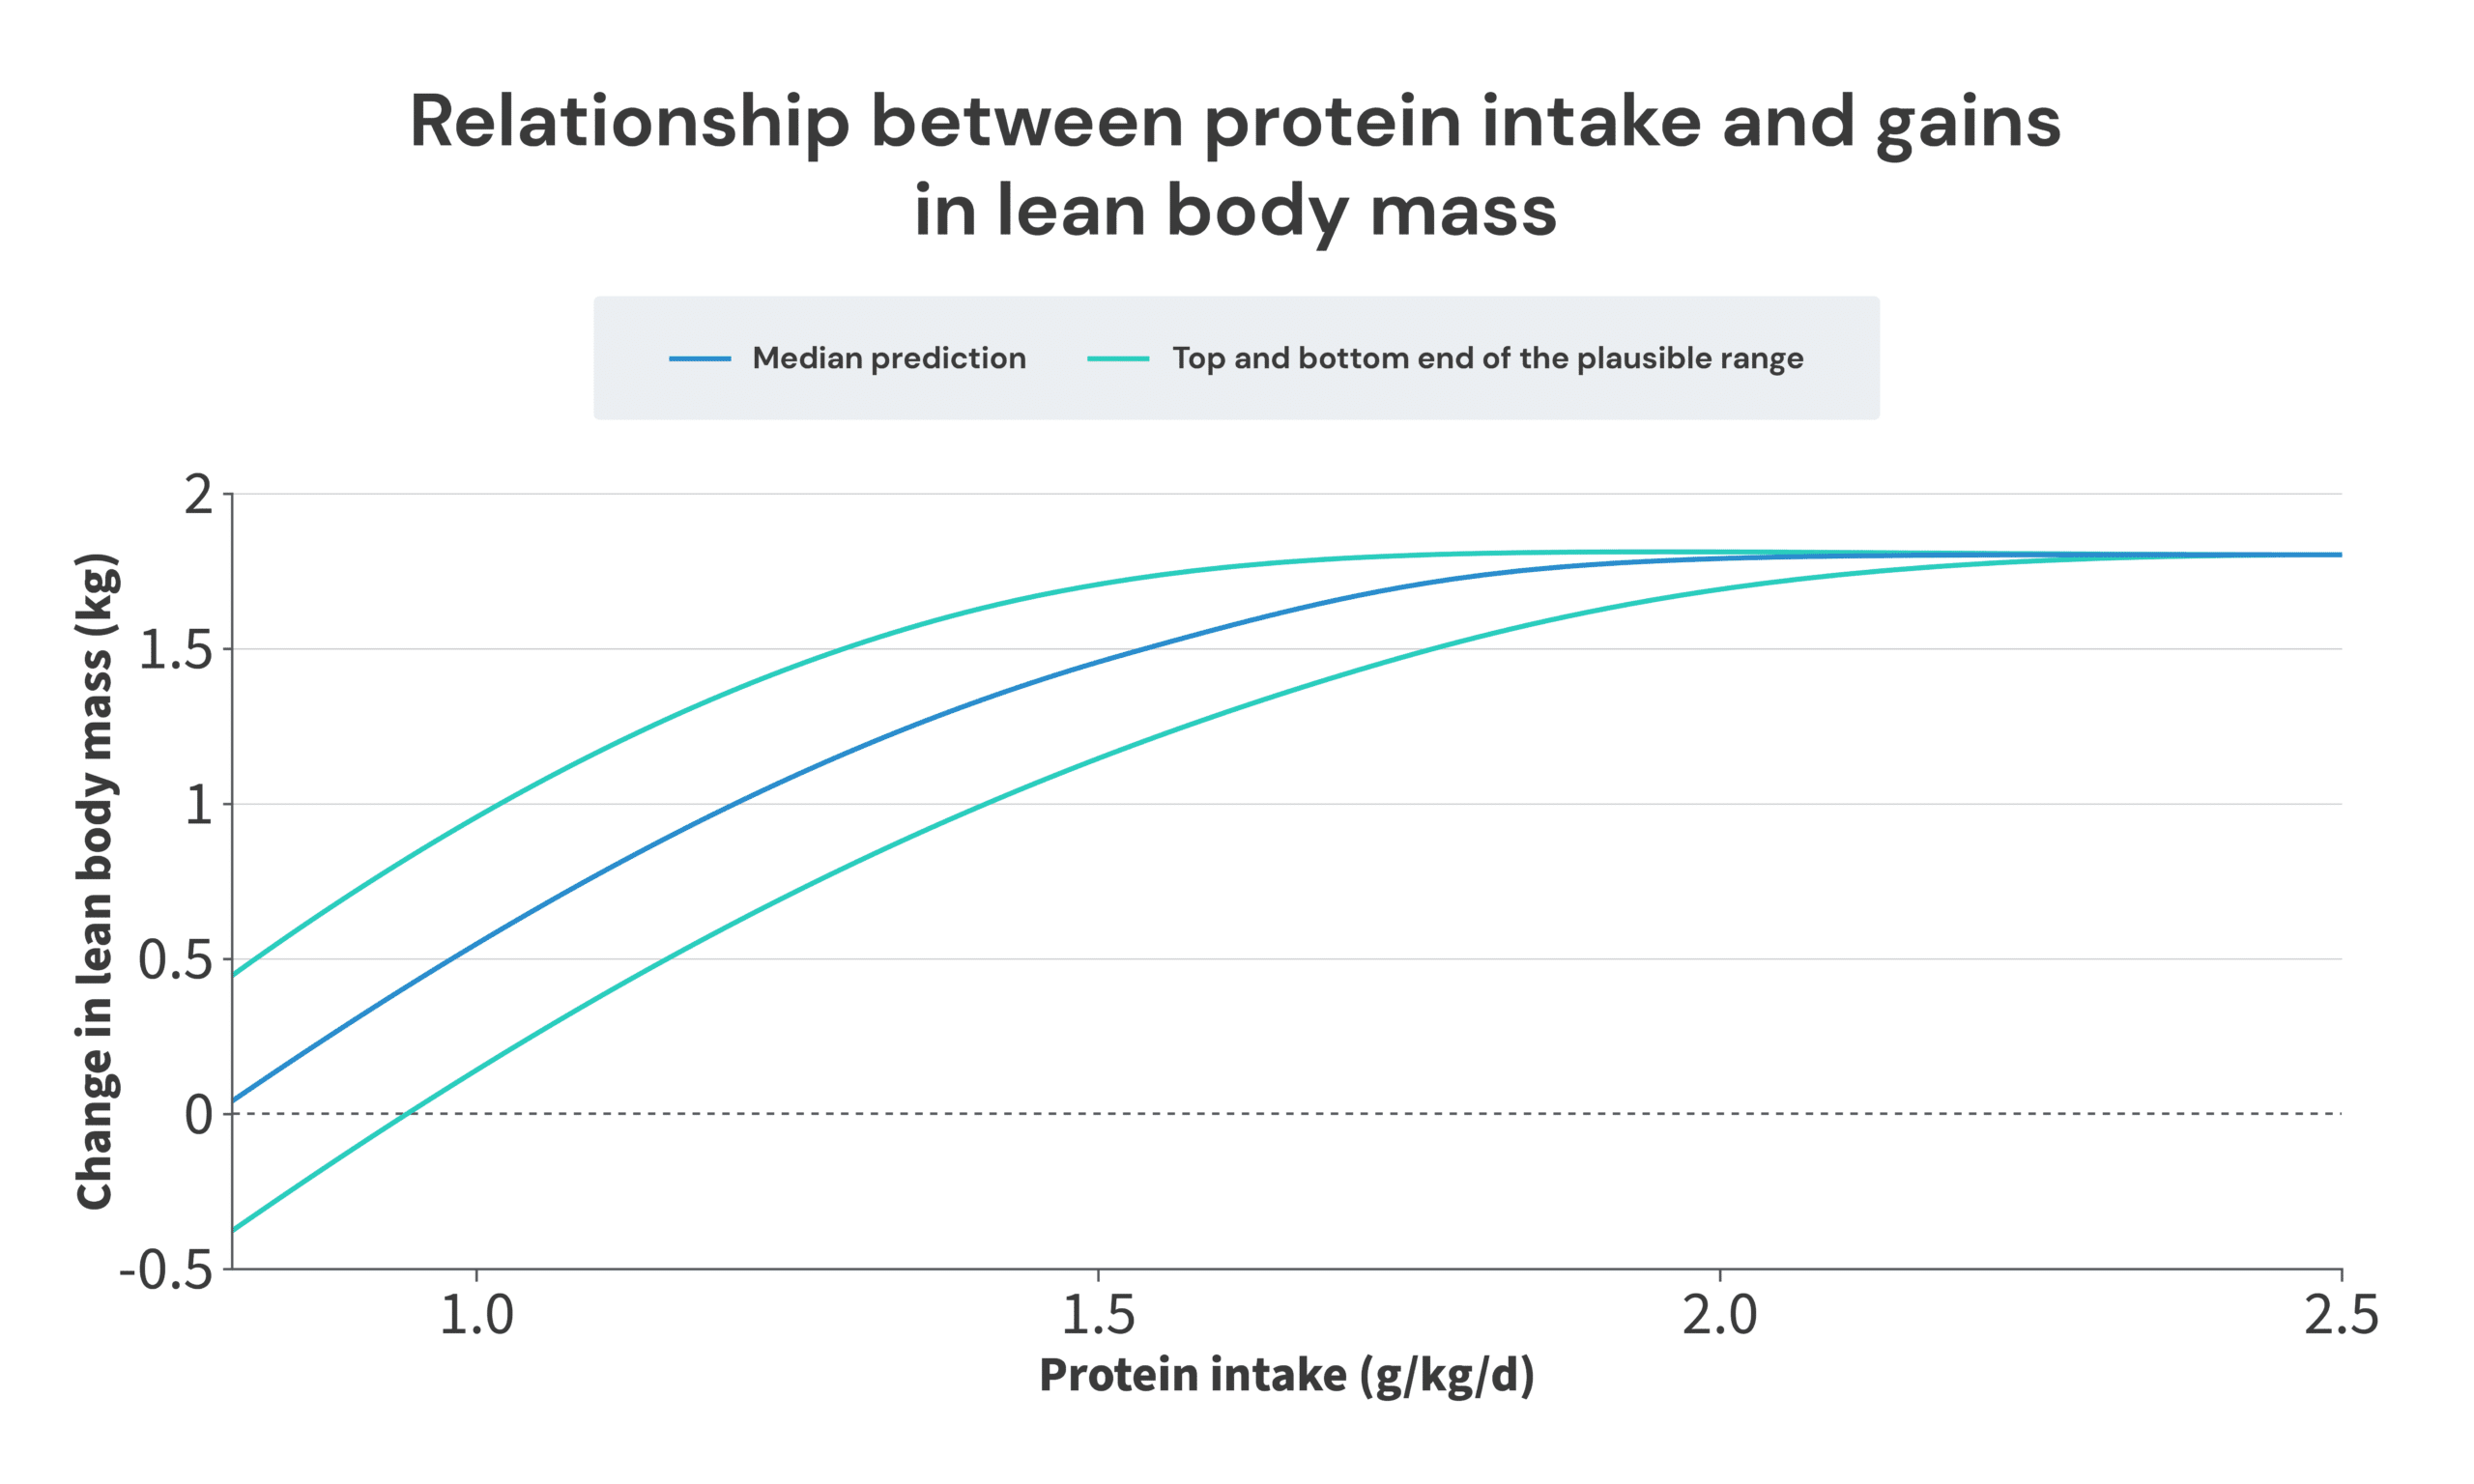

Ultimately, this paints a picture that’s not too dissimilar from where we started. I do think a thorough and careful analysis of this body of research suggests that there are benefits to consuming more protein than 1.62g/kg, but this analysis also suggests that you wouldn’t be leaving too many gains on the table by sticking with 1.62g/kg. The regression line from the Morton meta-analysis neatly splits the median (benefits top out at 2.0g/kg) and bottom-end predictions (benefits top out at 1.7g/kg). Furthermore, the most likely “breakpoint” identified in this article (2.0g/kg) is still within the breakpoint confidence interval of the Morton paper (1.03-2.20g/kg). So, I do still think the recommendations from the Morton meta-analysis are a bit too conservative, but I also don’t think I could be accused of coming up with recommendations that are entirely out of left field, and wildly inconsistent with the current consensus.
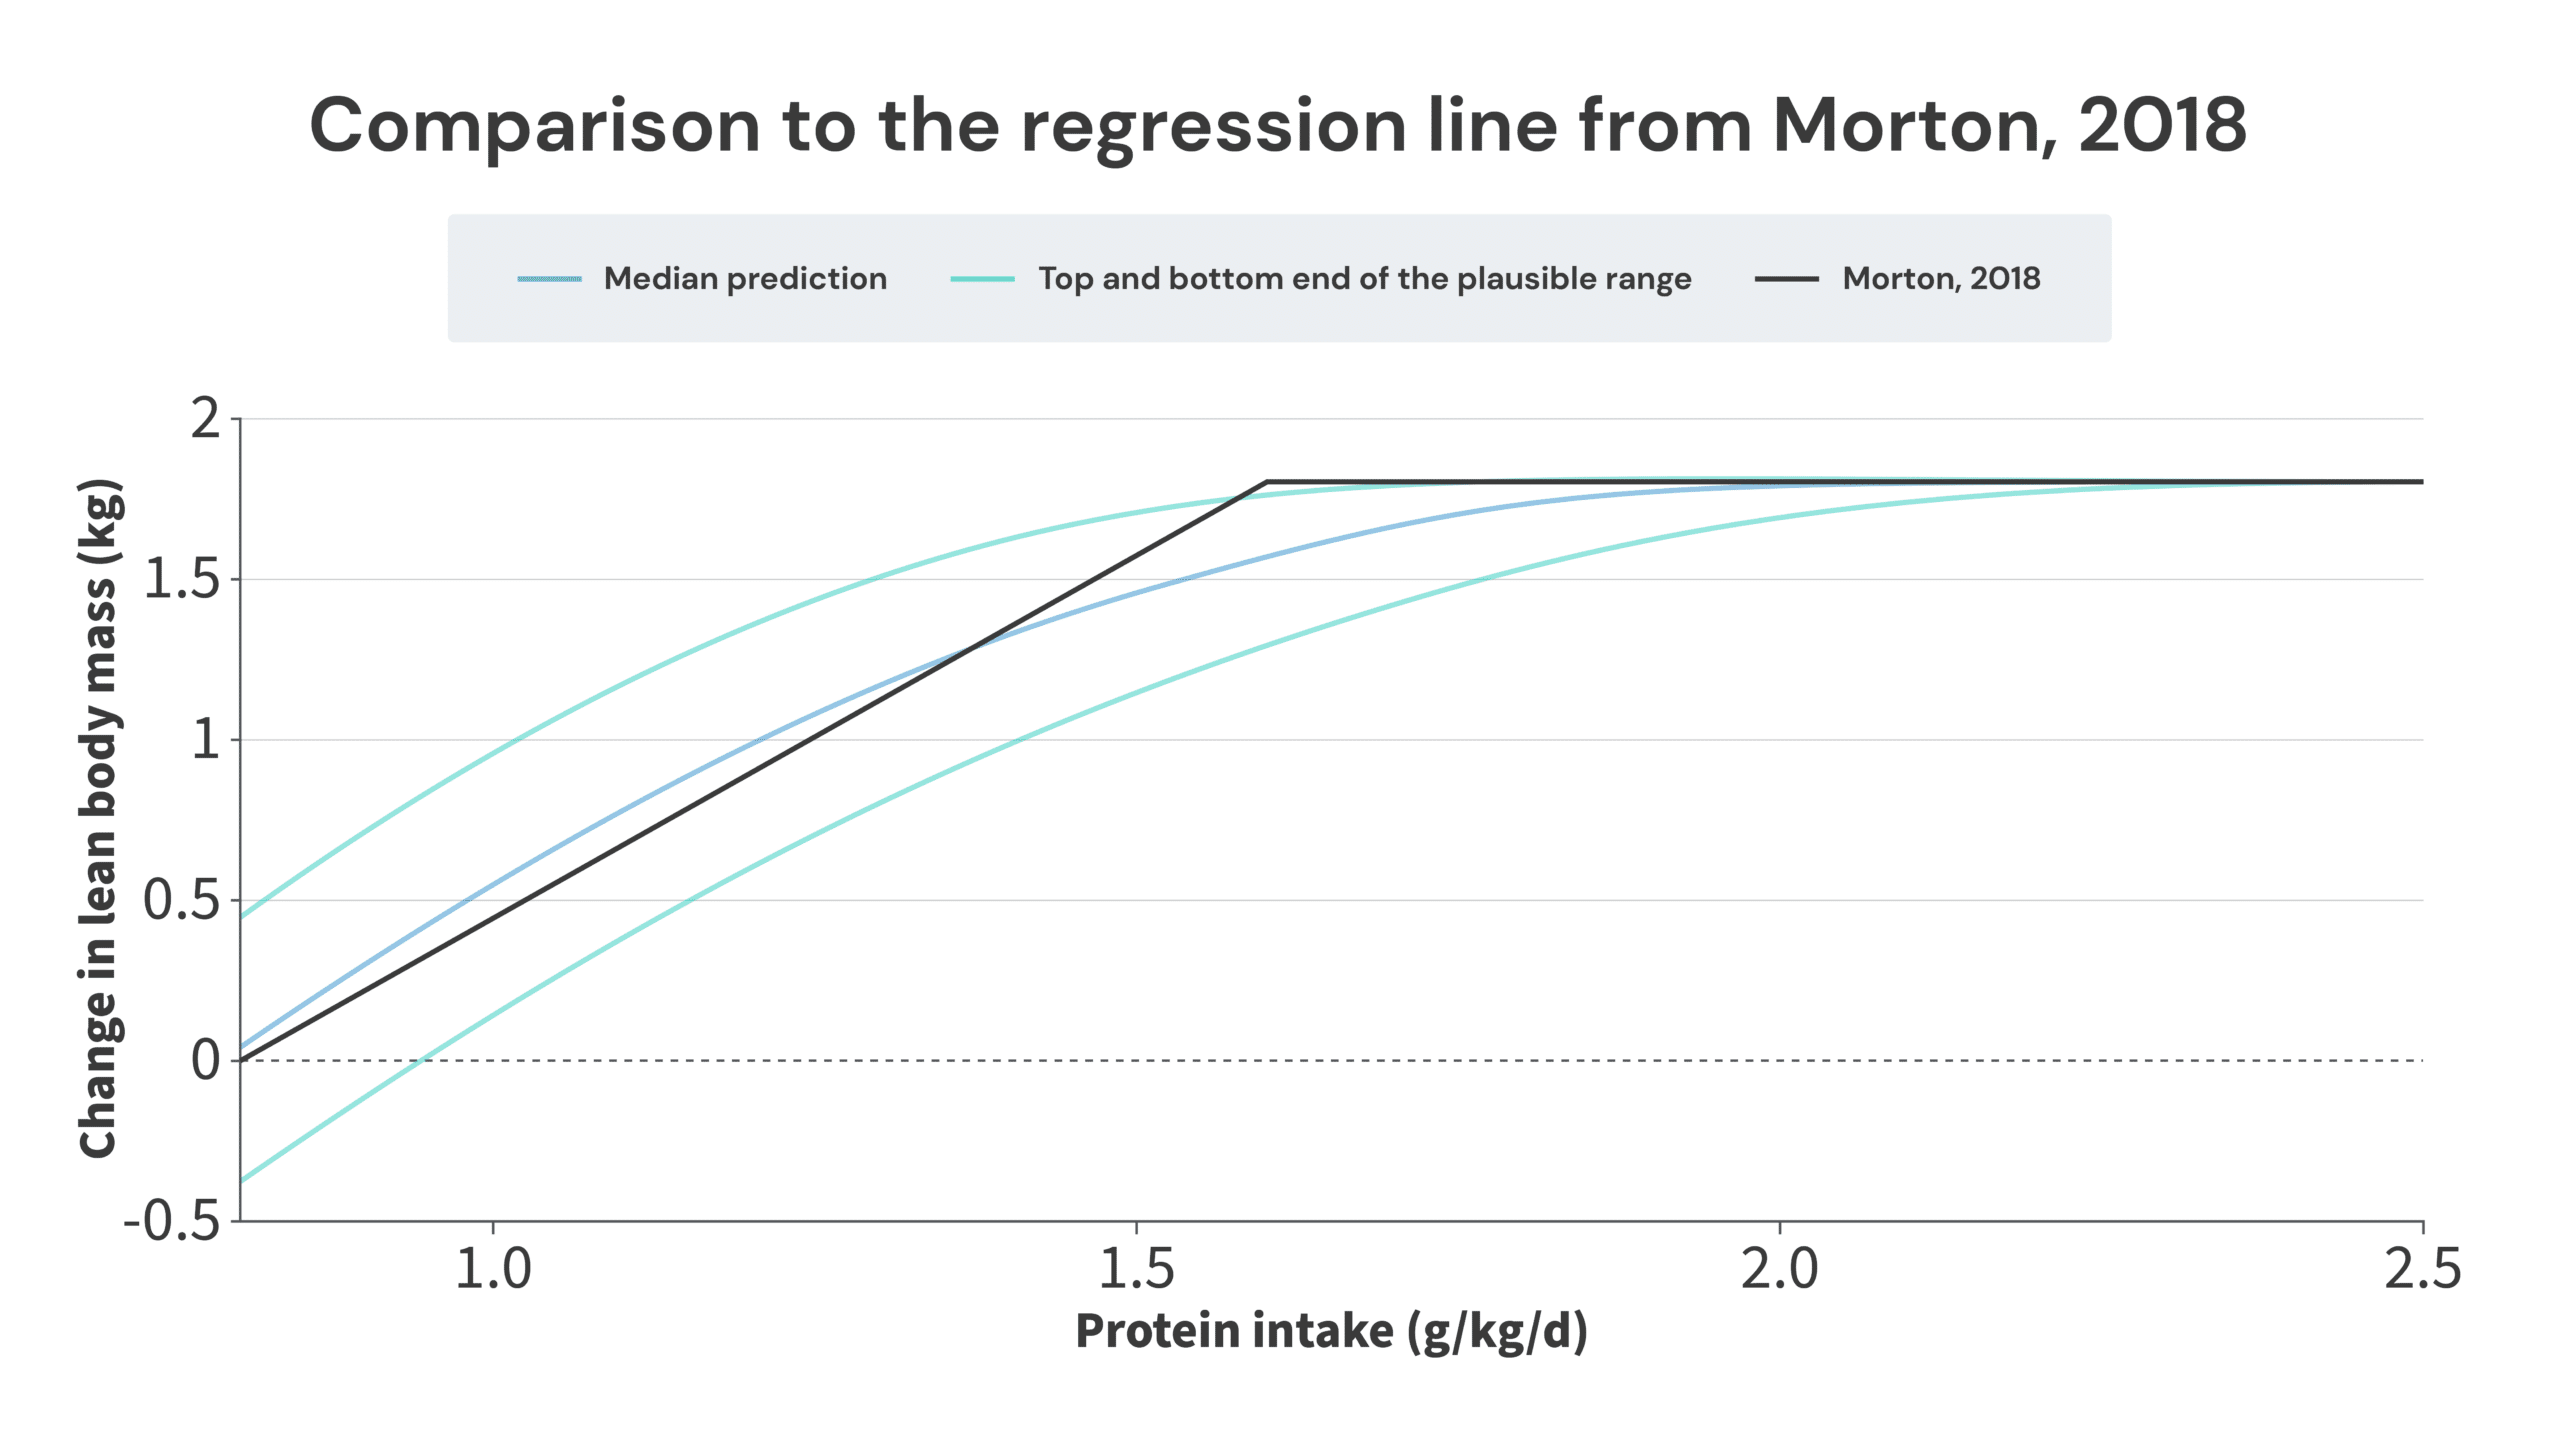

As a general note about the 1.7-2.35g/kg range proposed in this article, I have much more confidence about the bottom end of that range (the benefits of consuming more protein extend up to at least 1.7g/kg) than the top end, simply due to data density. In other words, we have a lot of examples of subjects increasing their protein intake from ~1.6-1.7g/kg to some higher level of protein intake, and gaining more FFM as a result, so we can be quite confident that the benefits of consuming more protein don’t max out below an intake of 1.7g/kg. However, we only have three studies with the midpoint of protein intakes between groups was above 2.35g/kg. In those three studies, higher protein intakes didn’t yield further increases in FFM, but ultimately, we are dealing with just three studies. With such a small body of research, it would only take a couple of positive findings to stretch the upper limit further. Furthermore, I personally felt comfortable excluding the Willoughby study from the analysis, but if you don’t, you could already make the case that there may be benefits of protein intake levels up to at least 2.5g/kg. The fact that the analysis of longitudinal studies matches up well with the upper end of values in the IAAO literature does give me a bit more confidence in 2.35g/kg being the upper end of the range, but I’m also open to the idea that it may end up being 0.1-0.2g/kg lower, or 0.2-0.4g/kg higher, once we have more studies testing the effects of really high protein intakes.
Relatedly, subjects tend to slightly under-report their protein intake (by about 5%). Protein intake in longitudinal studies is almost always assessed via self-report (typically via food diaries). This small bias may be carried through all of these analyses. So, the actual optimal protein intake range may be around 5% higher than a direct reading of the research would suggest. However, I also find it plausible that resistance trainees may not under-report their protein intake (I wouldn’t even be surprised if they slightly over-report their protein intake). So, since the potential bias is small, and I’m not confident that it would even apply to the specific populations of subjects in these studies, I chose to not correct for it.
I’d also just like to note that I don’t fault the researchers involved with the Morton paper for (what I believe to be) the shortcomings of their analyses. Neglecting to account for the potential influence of Simpson’s paradox is an incredibly easy oversight to make, and the analyses performed in that study were significantly better than anything that existed in the published literature up to that point.
Before I wrap up, I also feel obliged to include this note: I’m not saying that everyone needs to consume 2.35g/kg. I think that (and my analysis suggests that) an intake of around 1.2-1.5g/kg will still allow you to achieve most of your potential gains. So, if you don’t prefer really high protein intakes, that’s totally fine. I do think you’ll probably be leaving some gains on the table, but I also think you’ll be able to make some really solid gains.
Takeaways
- A protein intake of around 2g/kg (0.9g/lb) is required to maximize gains for men, on average.
- If you’re a man wanting to take a “better safe than sorry” approach to protein intake, aiming for 2.35g/kg (1.07g/lb) should do the trick. That should maximize muscle growth in the vast majority of individuals.
- If we split the difference, the old “1g/lb” rule actually seems to match the research quite well.
- Intake targets for women should probably be about 10-15% lower. Aiming for 1.75g/kg (around 0.8g/lb) should maximize muscle growth, on average. If you’re a woman wanting to take a “better safe than sorry” approach to protein intake, 2.05g/kg (0.93g/lb) should do the trick.
- If you have a rough idea of your body composition, it’s probably best to scale protein targets to fat-free mass, rather than total body mass. 2.35g/kg of fat-free mass (1.07g/lb of fat-free mass) should maximize your gains, on average, and 2.75g/kg of fat-free mass (1.25g/lb of fat-free mass) serves as a great “better safe than sorry” target.
- If you have a preference for lower protein intakes, aim for ~1.2-1.5g/kg (0.55-0.7g/lb). This should still allow you to achieve most of your potential gains, while having considerably more dietary flexibility.

